This is an accordion element with a series of buttons that open and close related content panels.
About this page
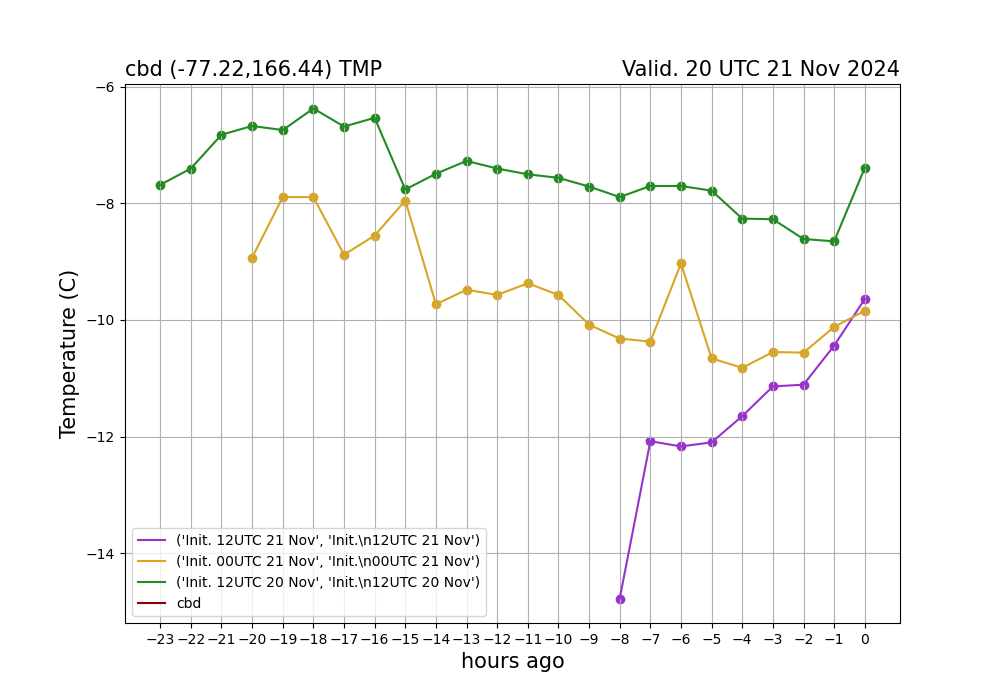
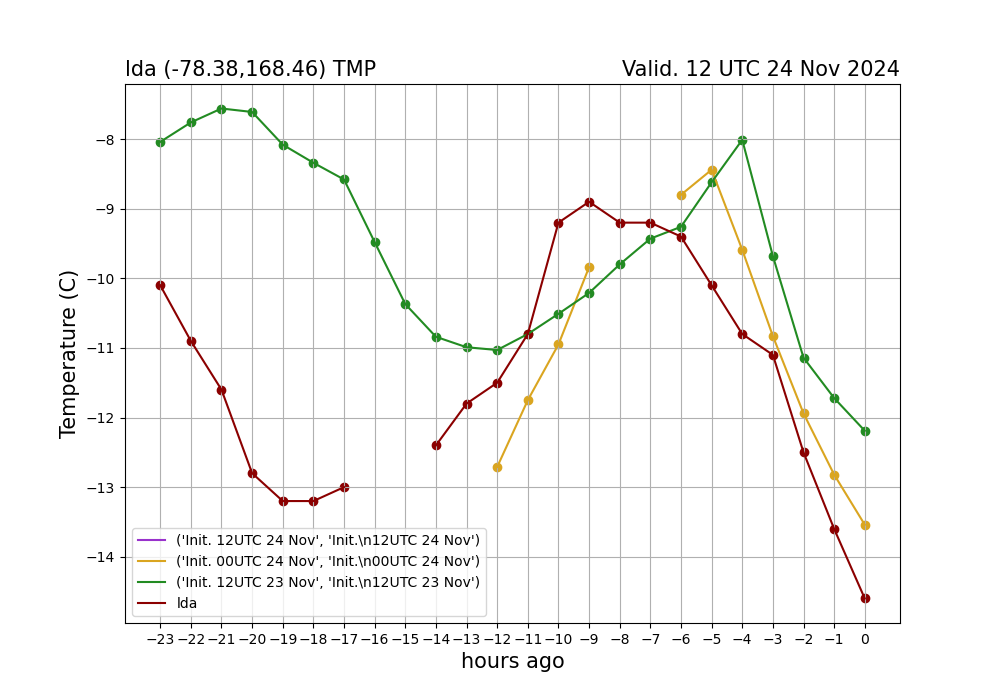
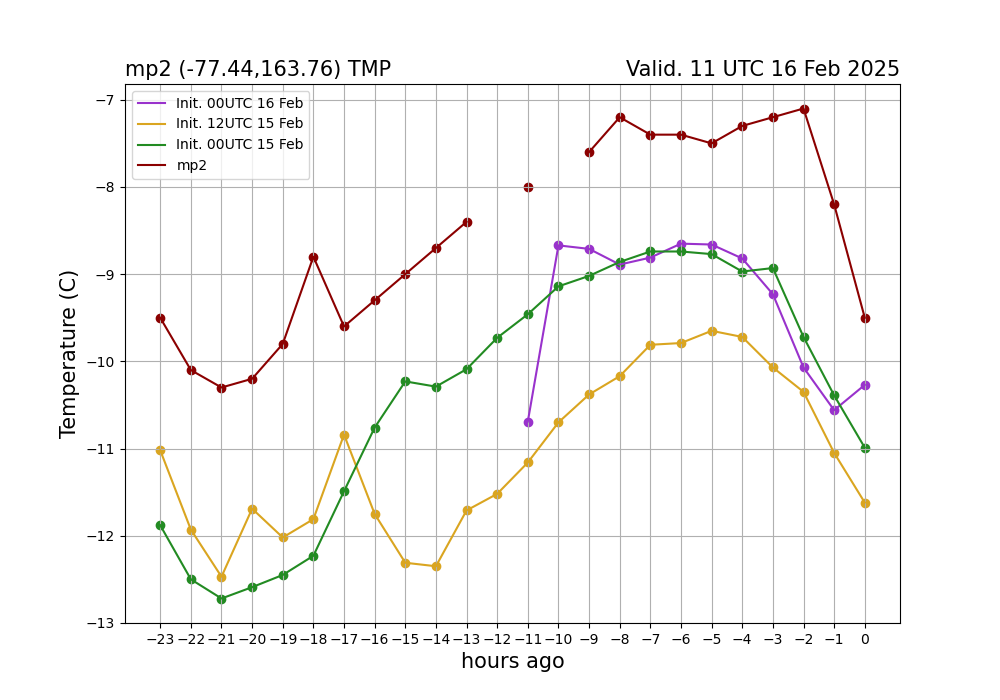
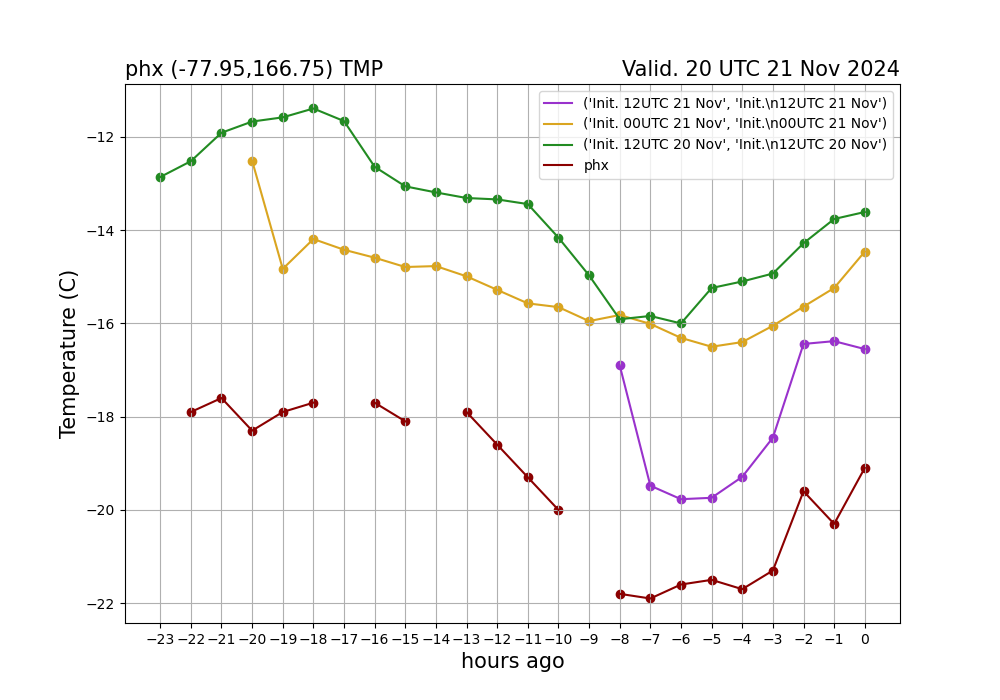
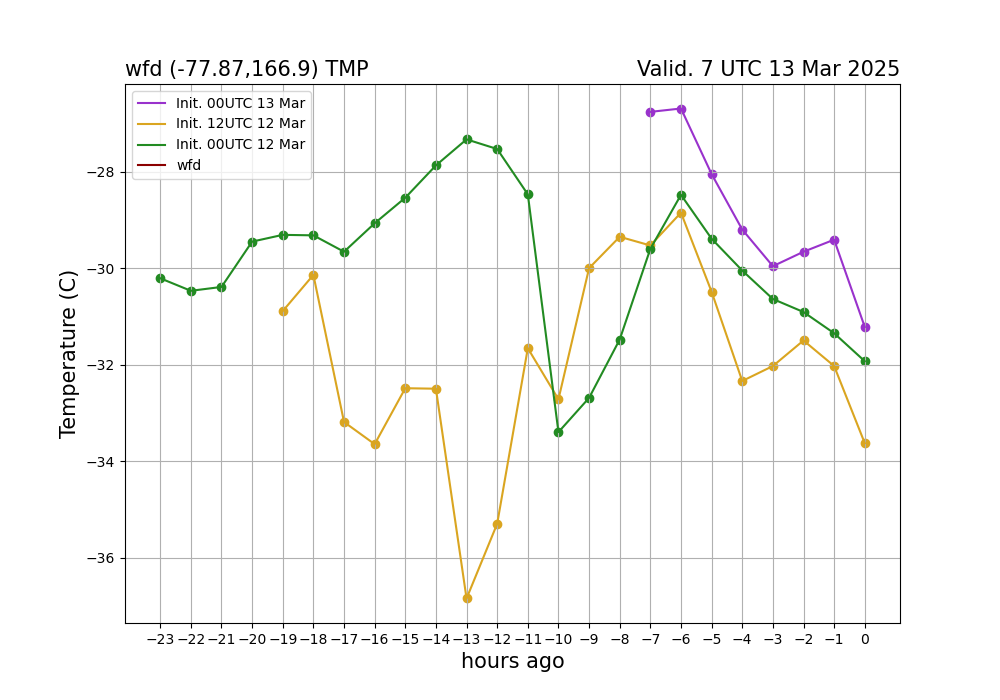
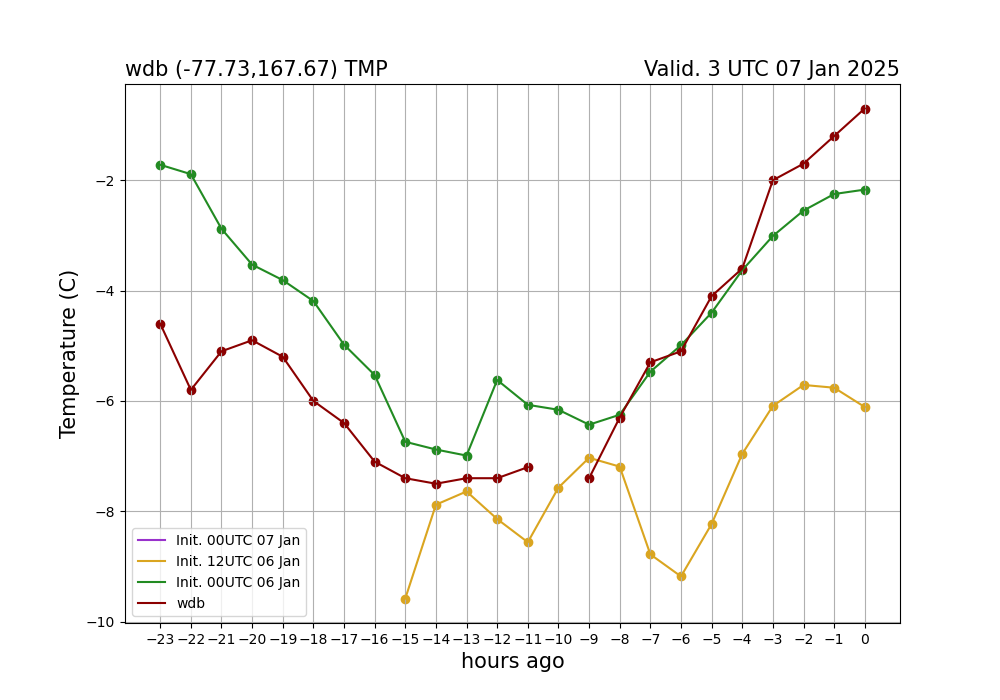
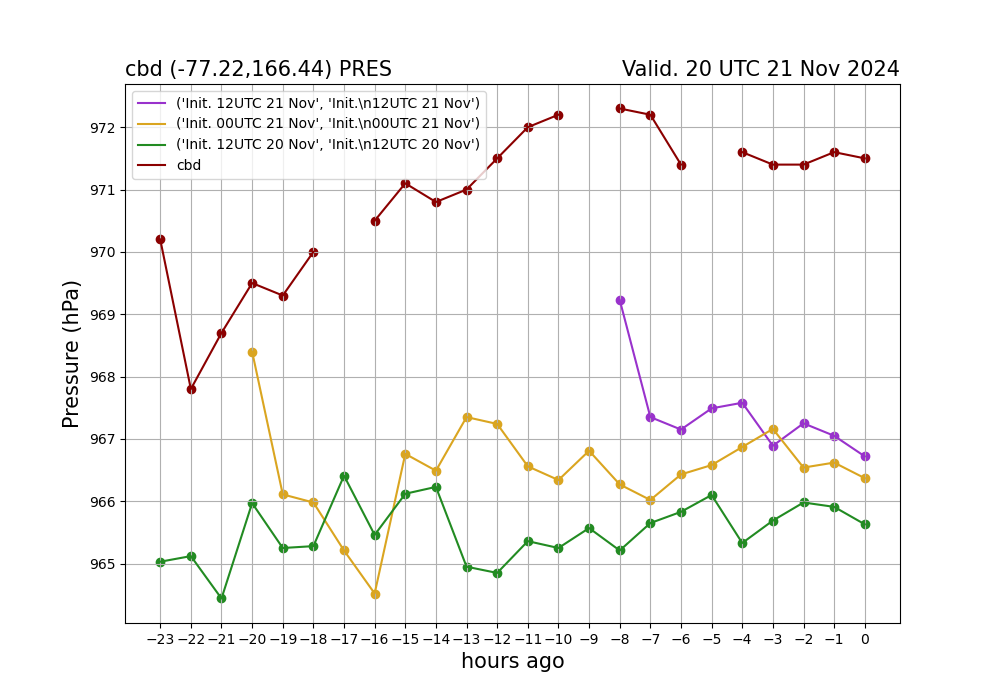
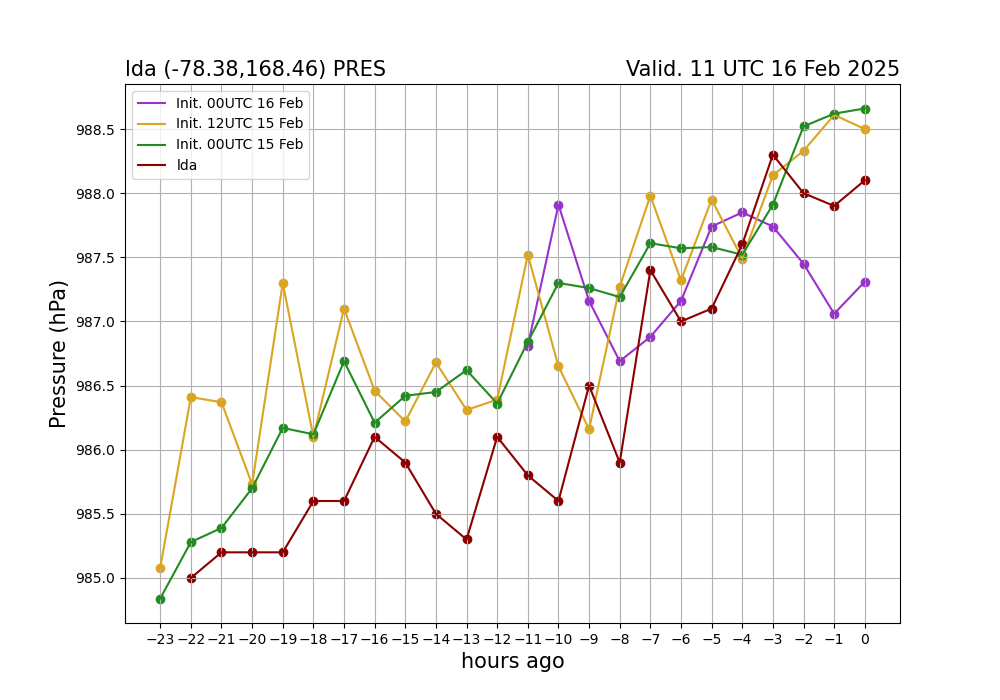
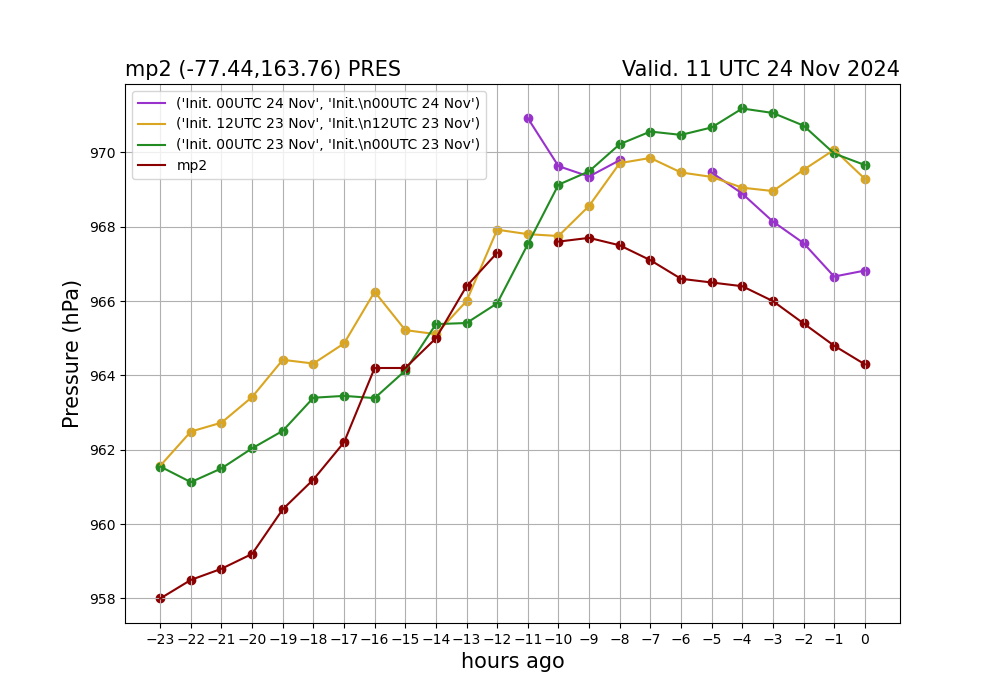
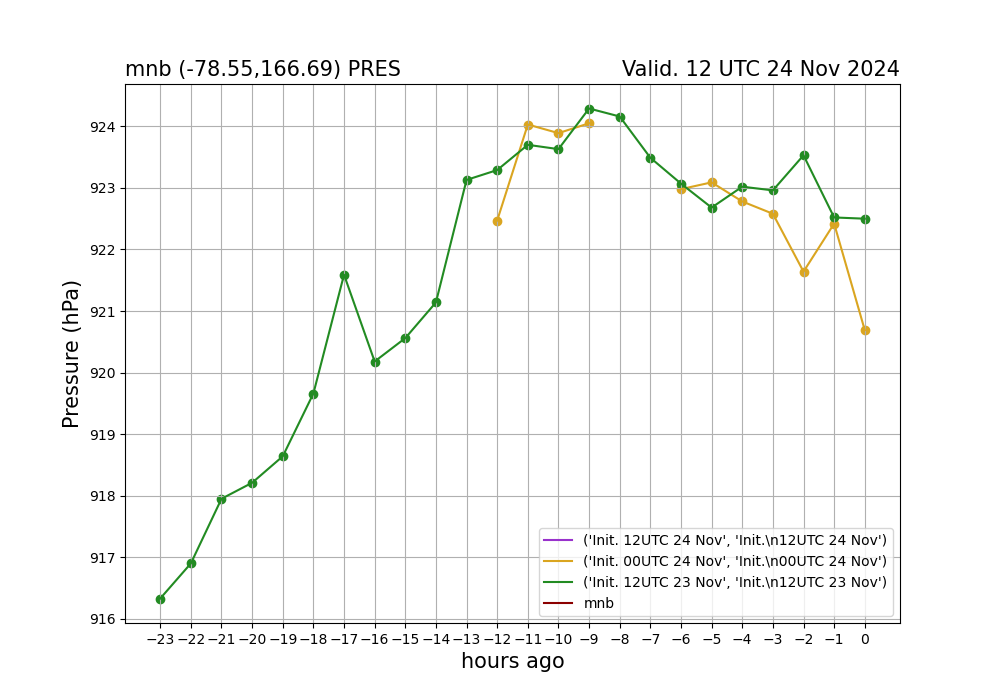
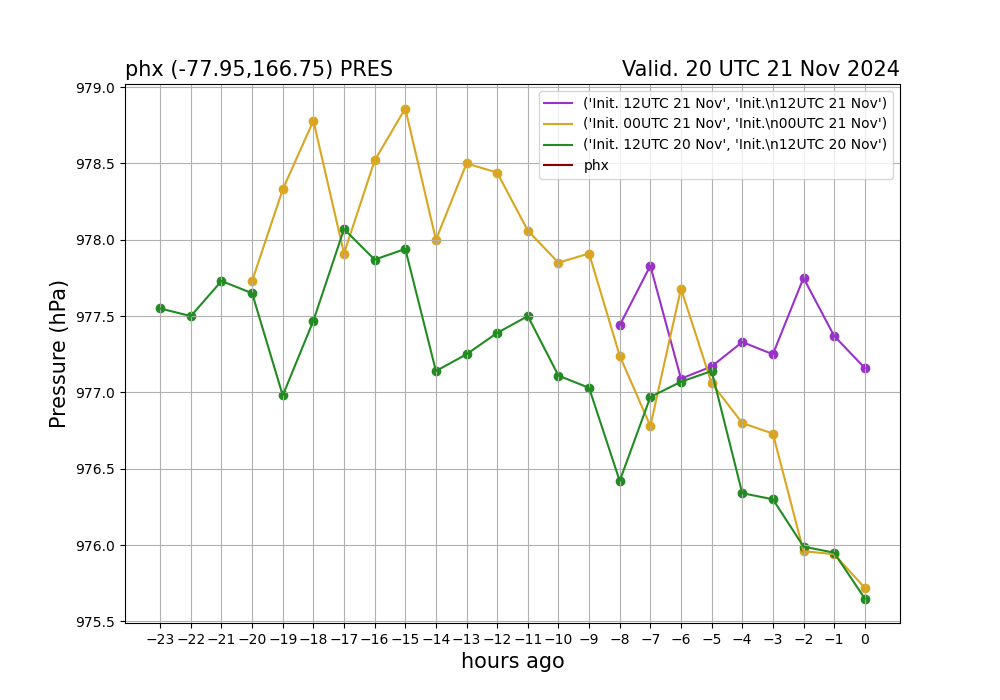
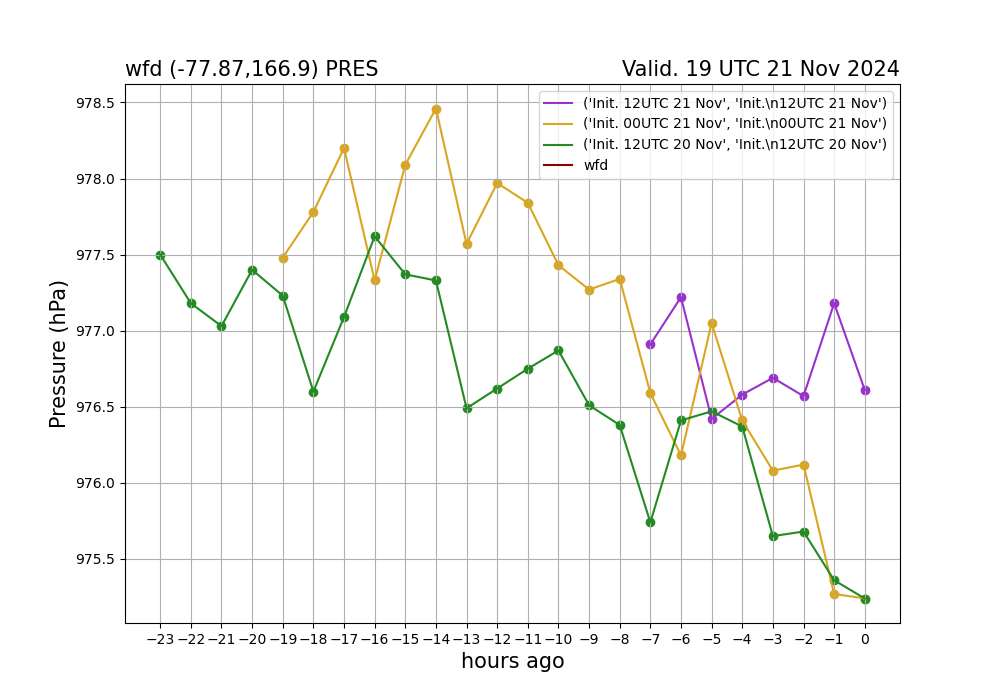
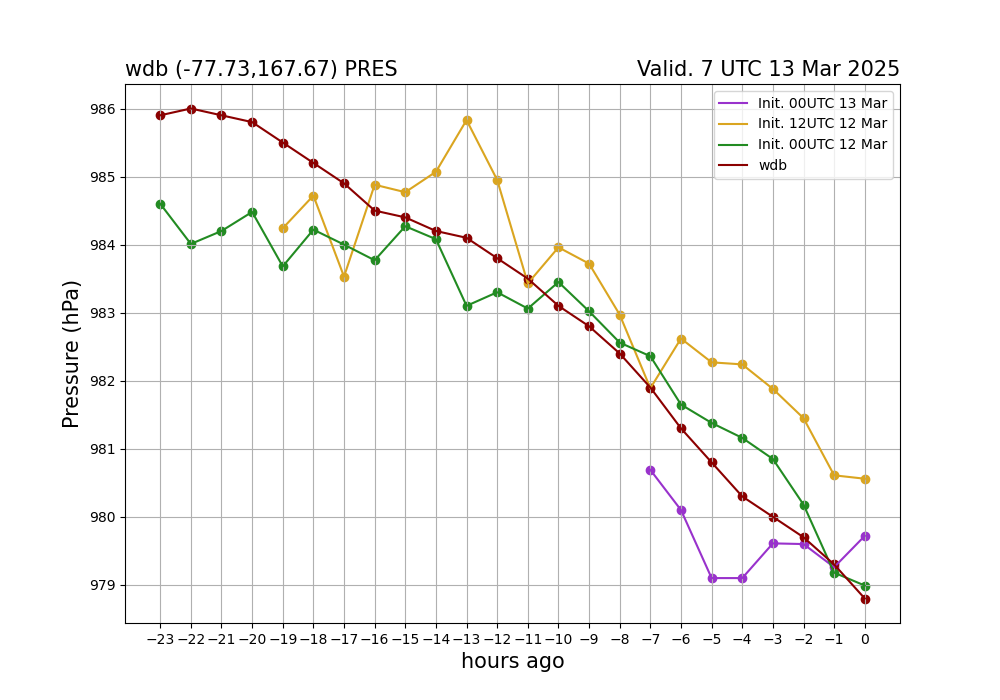
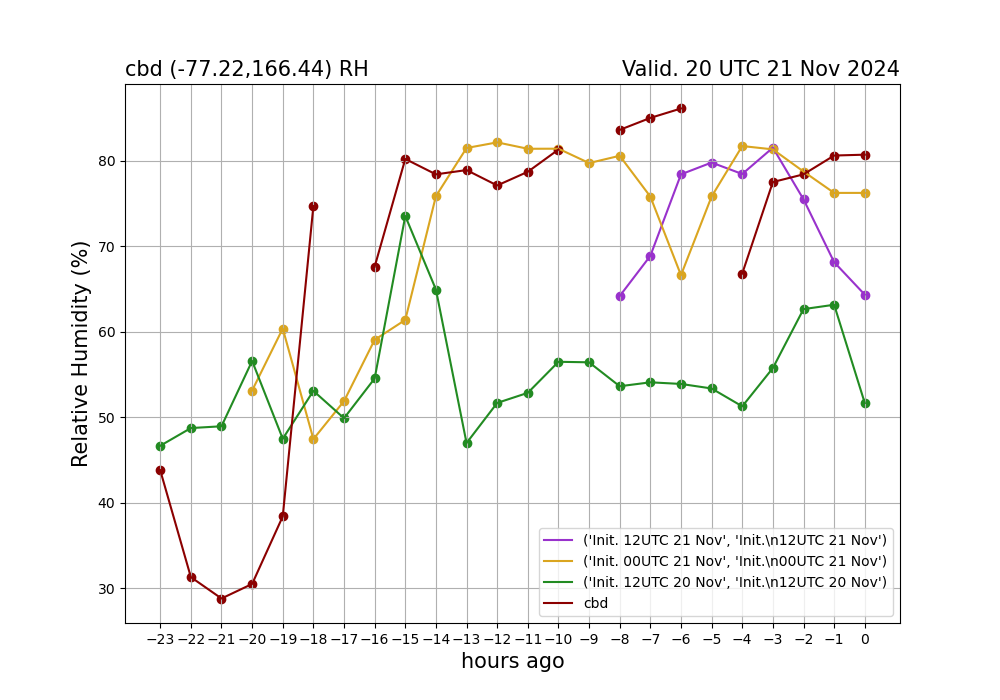
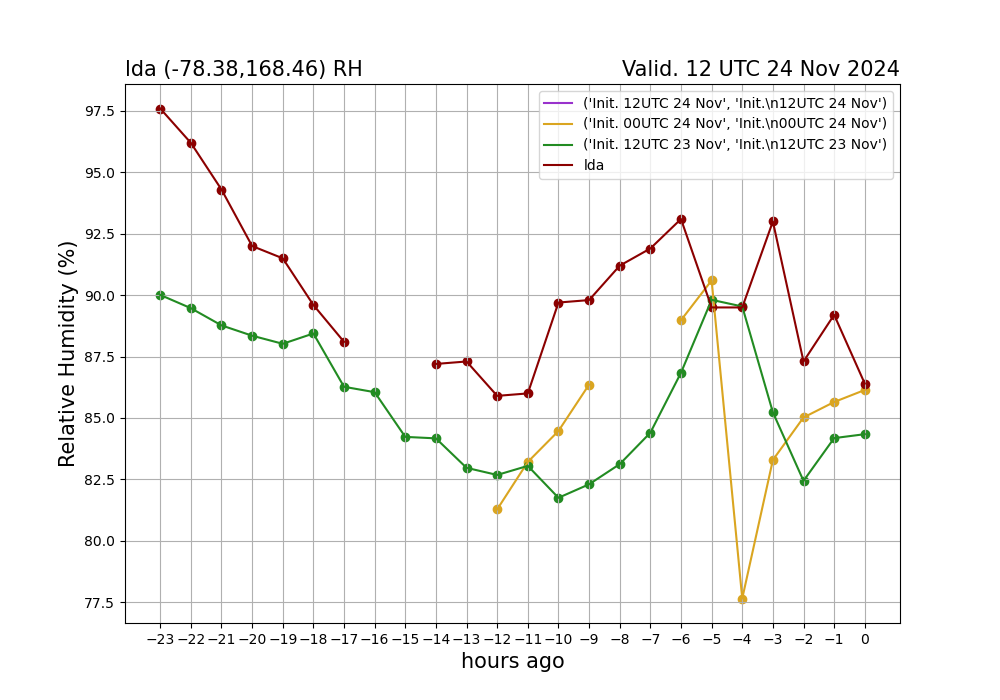
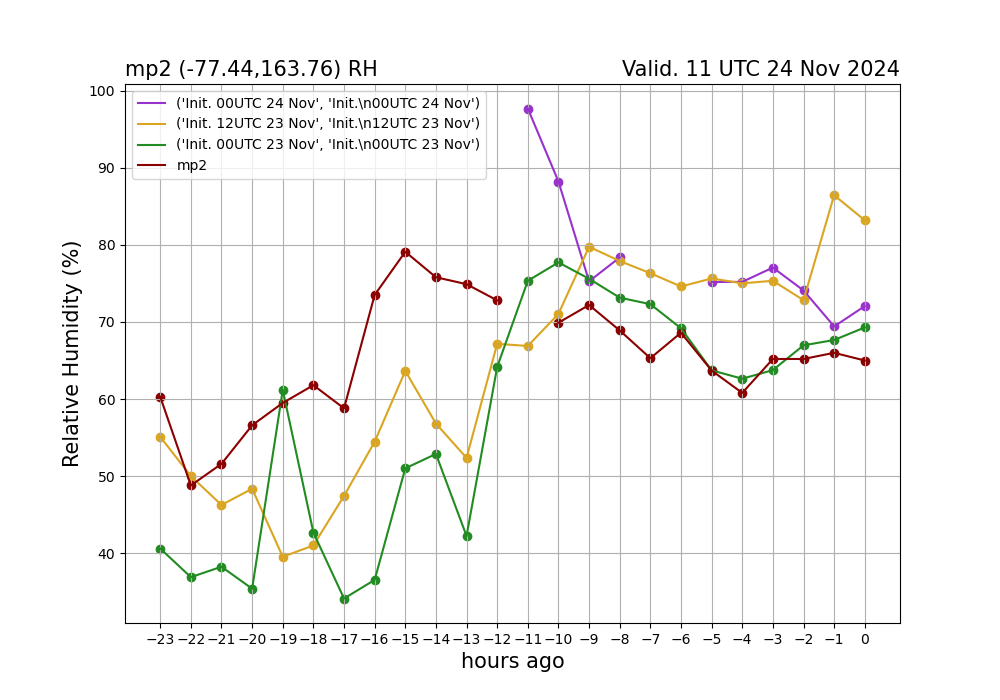
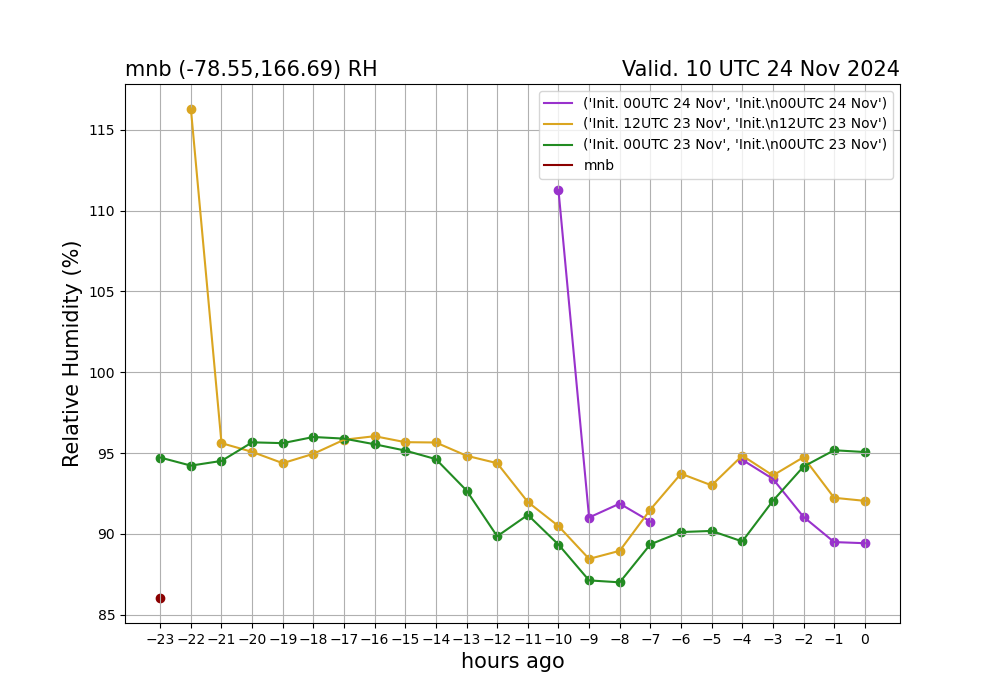
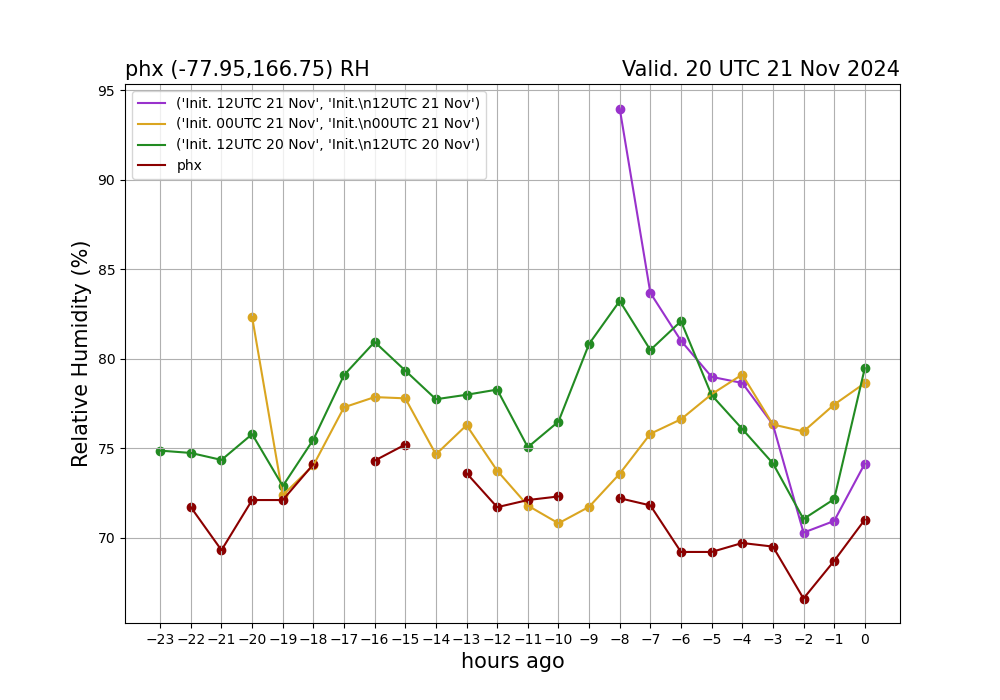
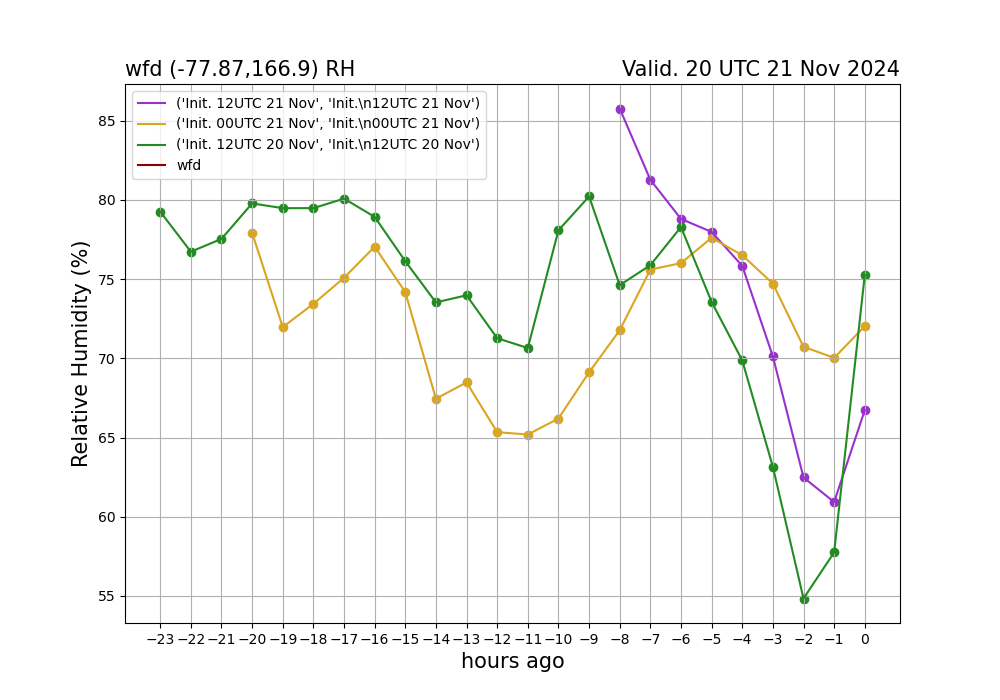
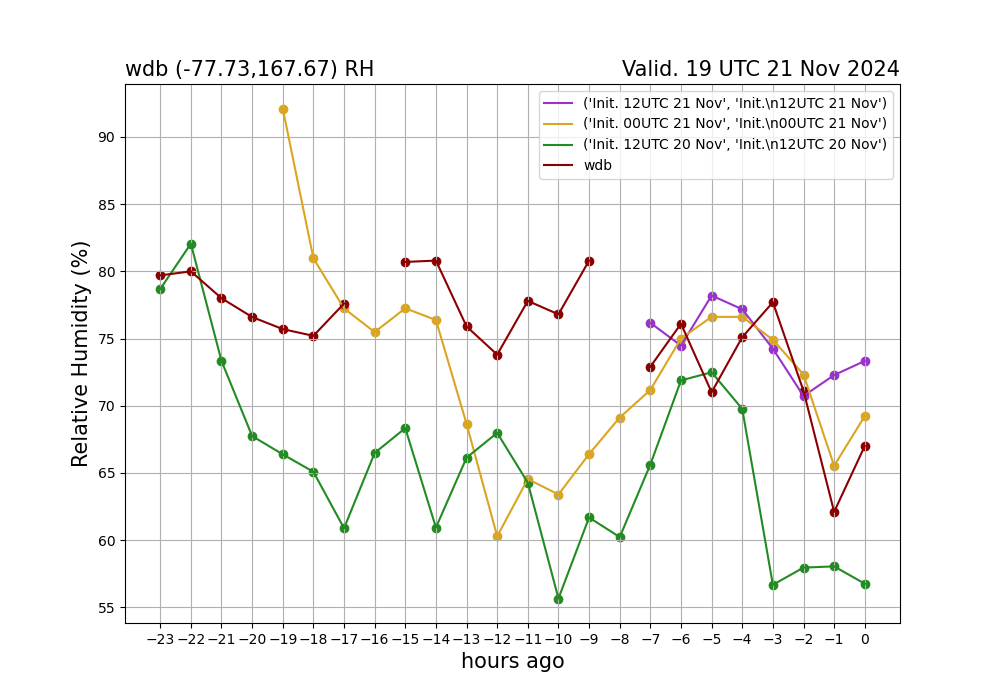
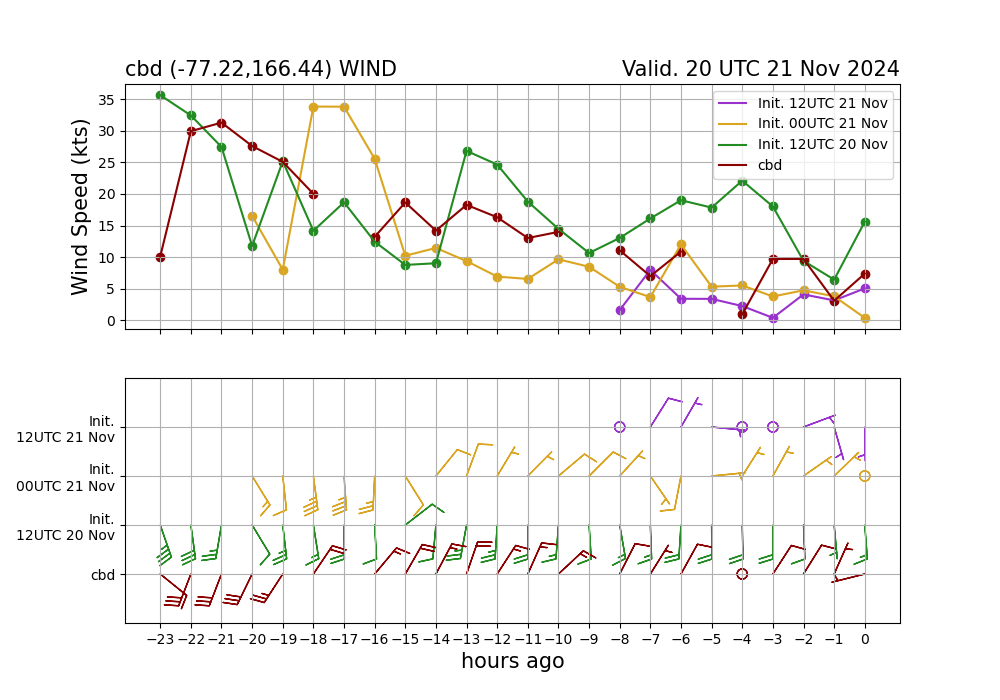
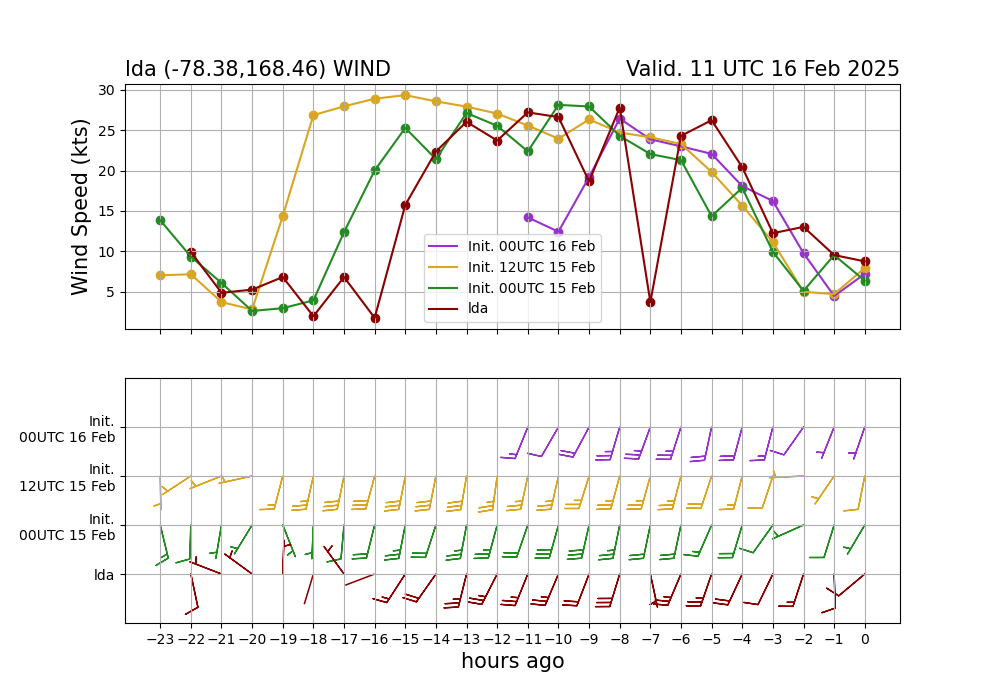
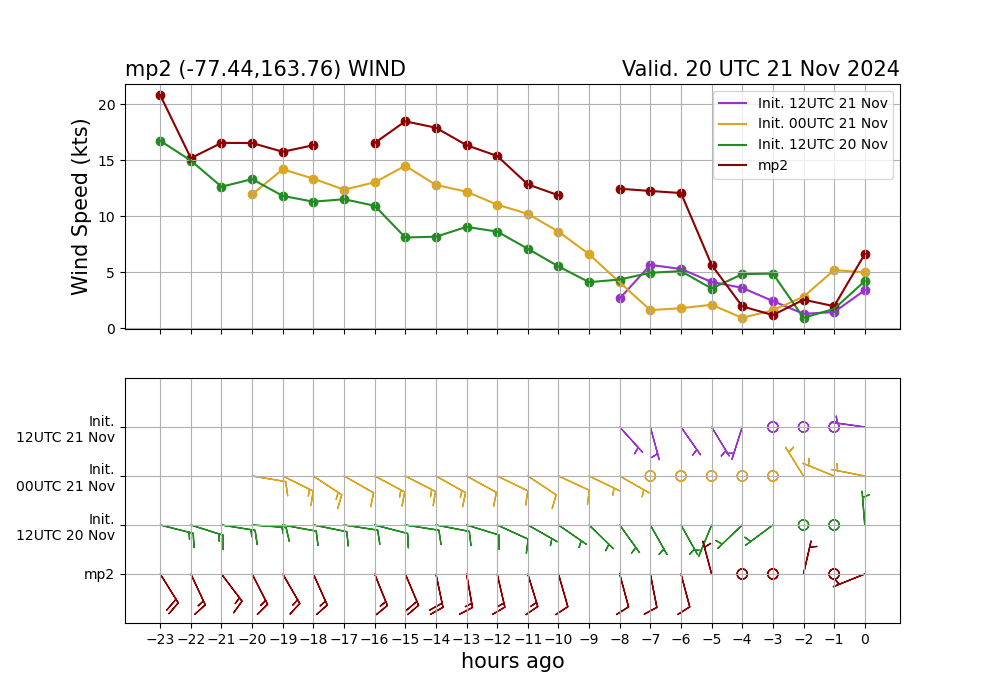
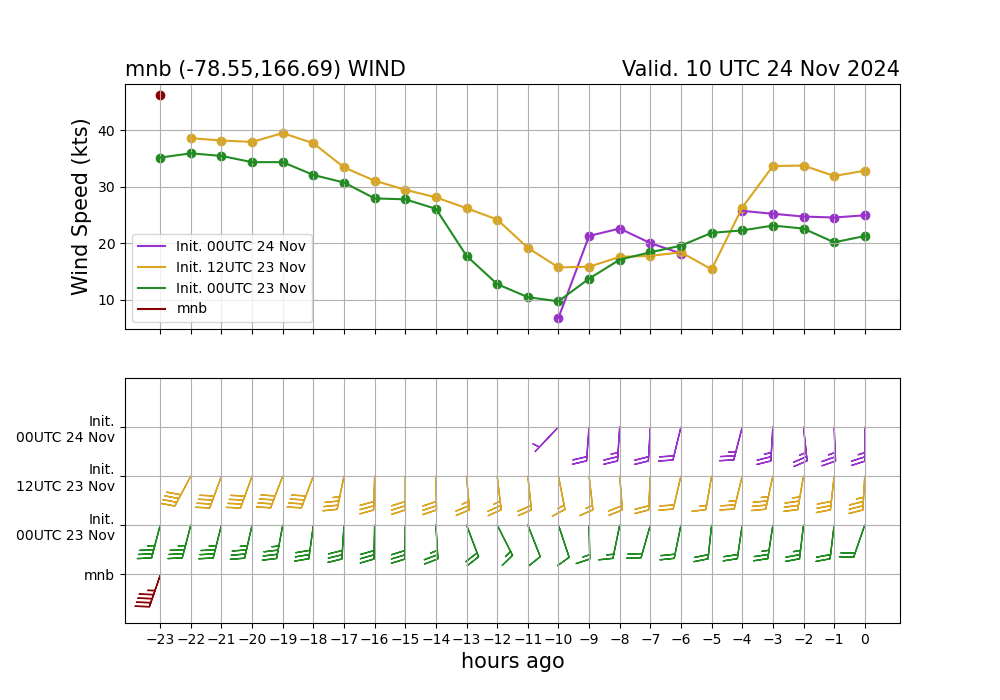
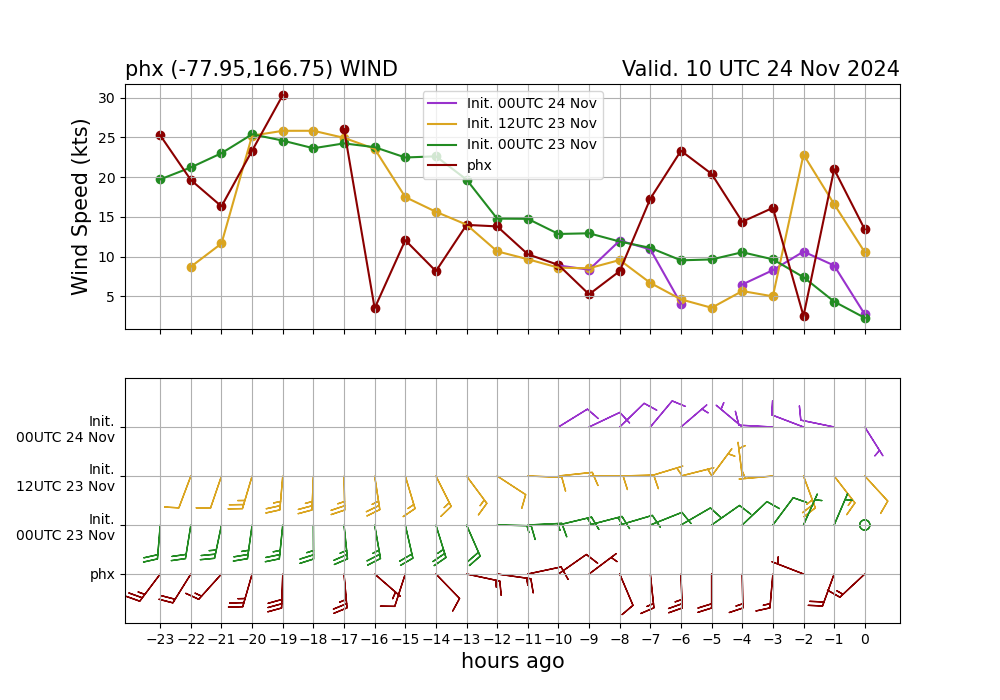
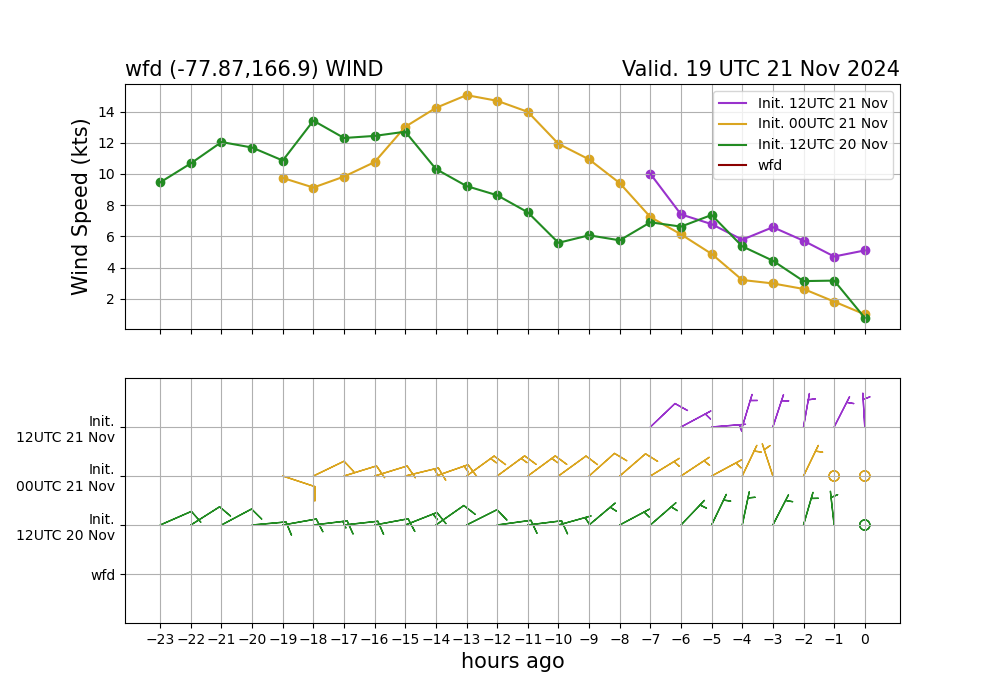
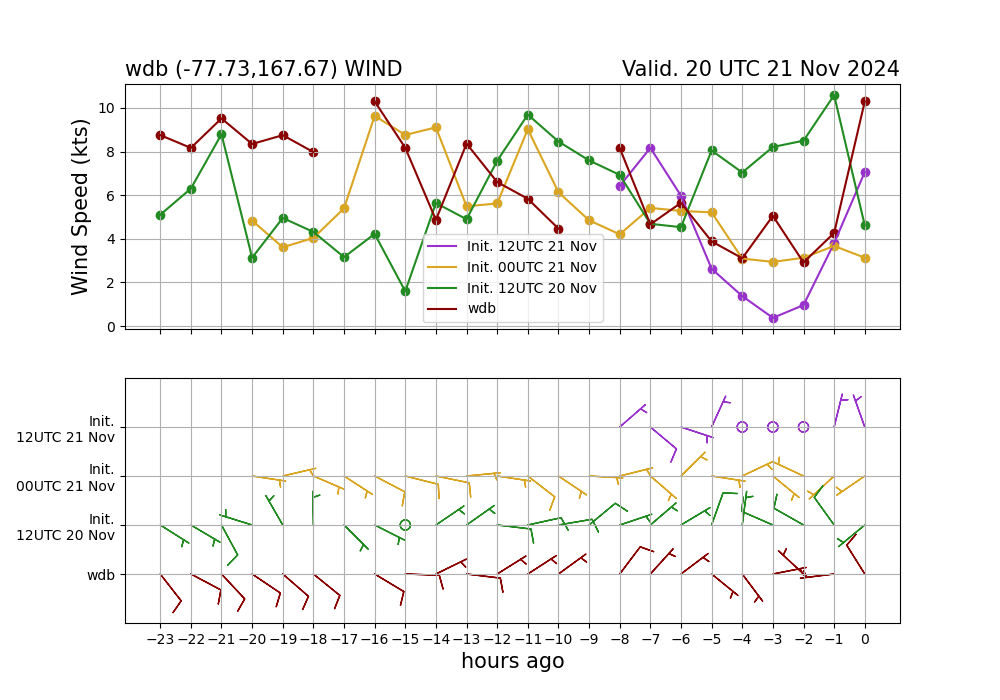
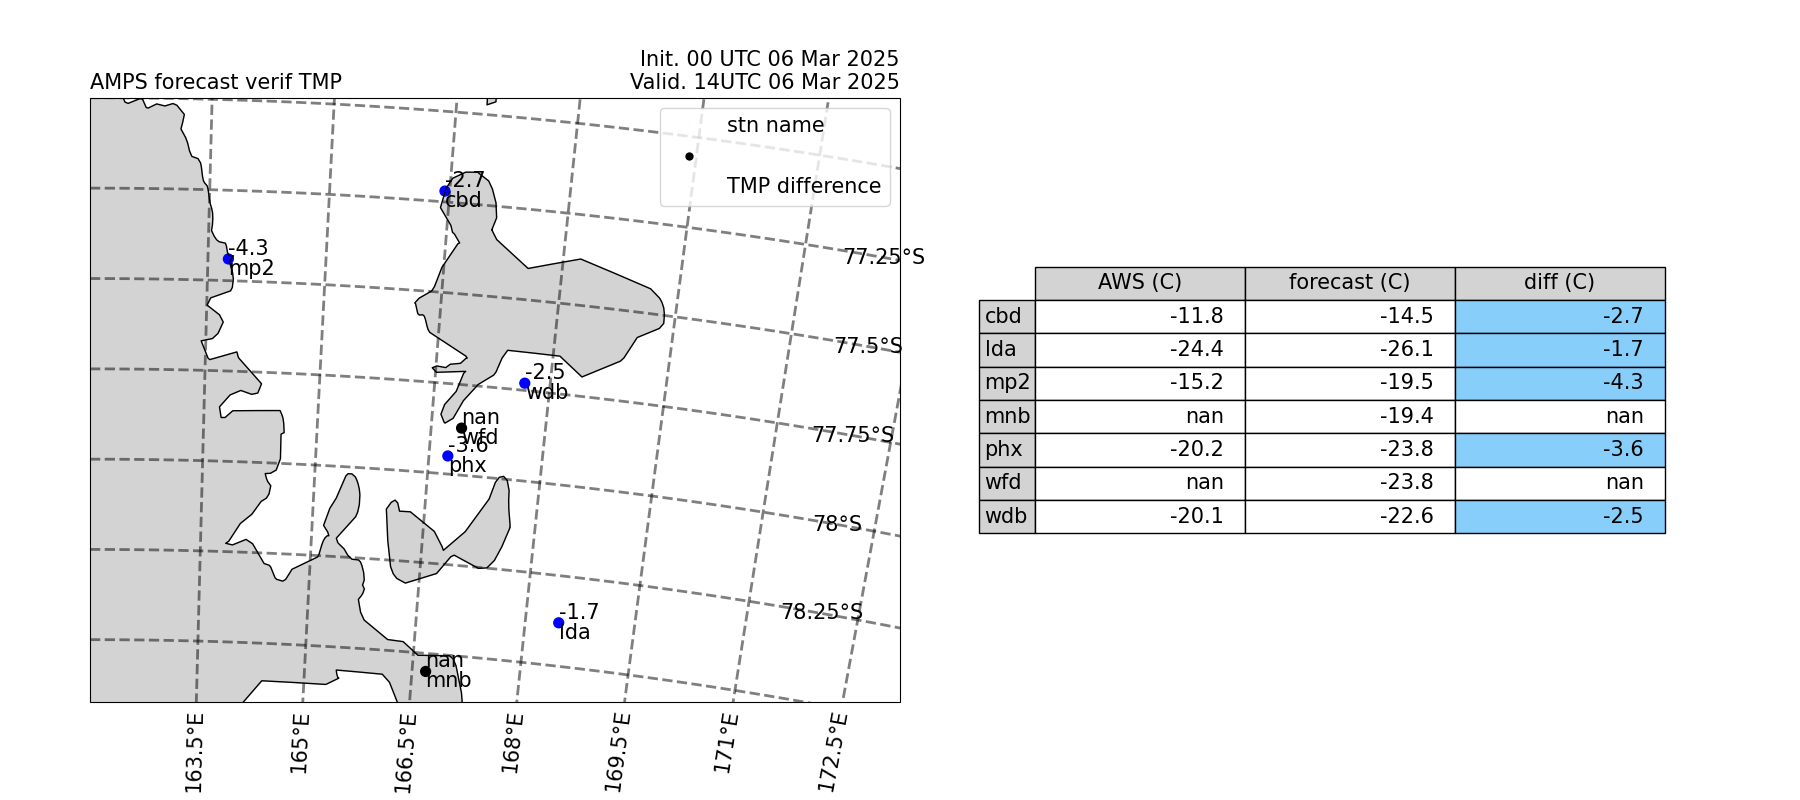
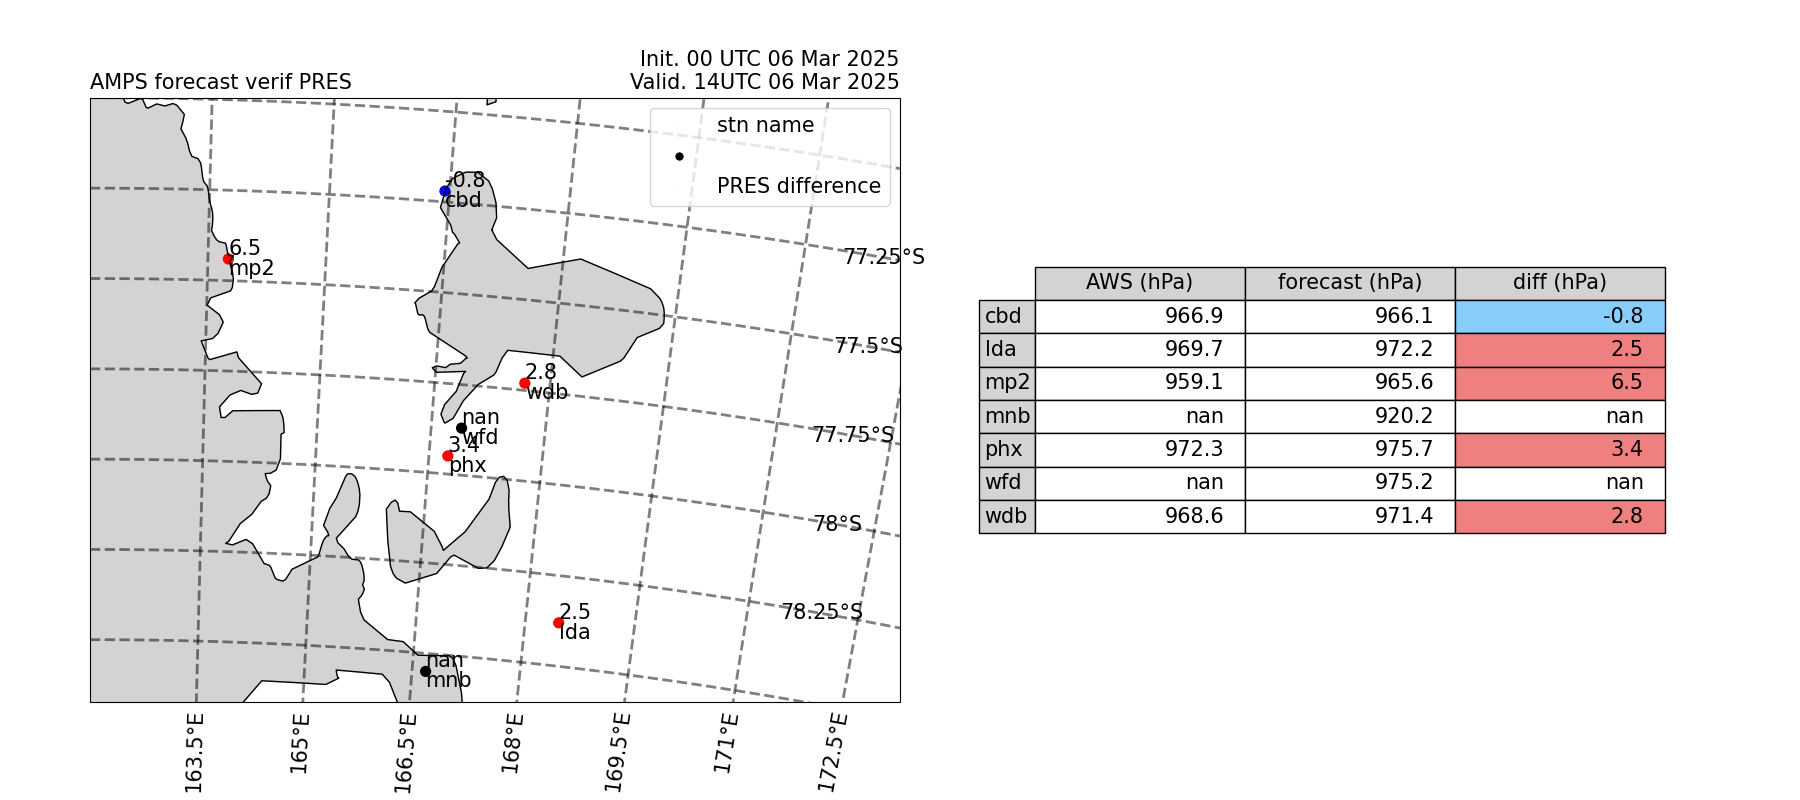
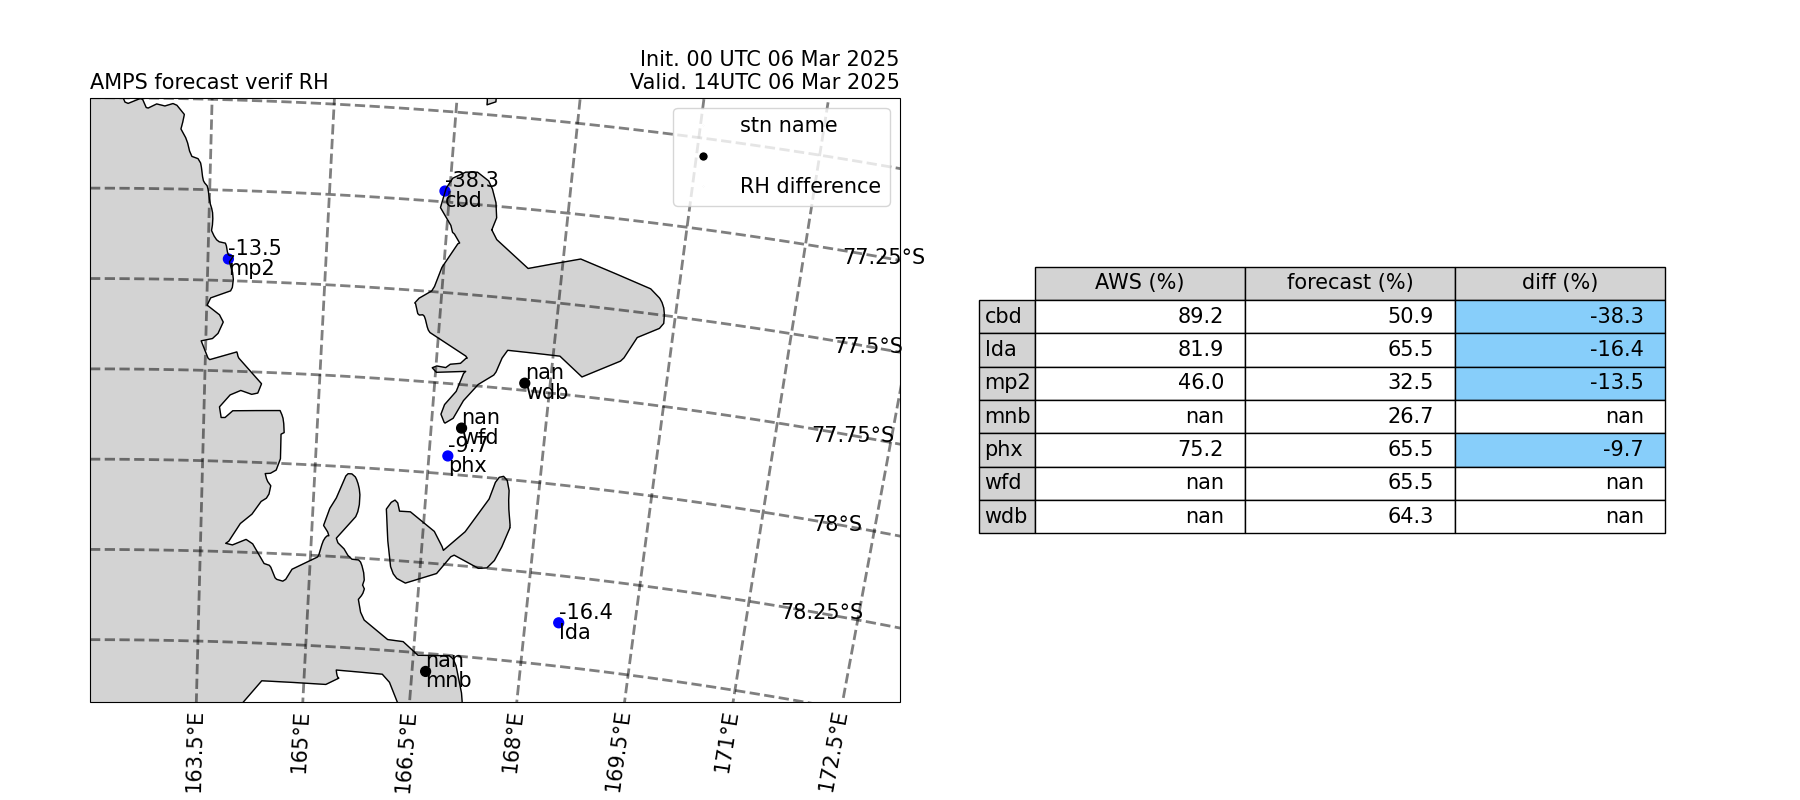
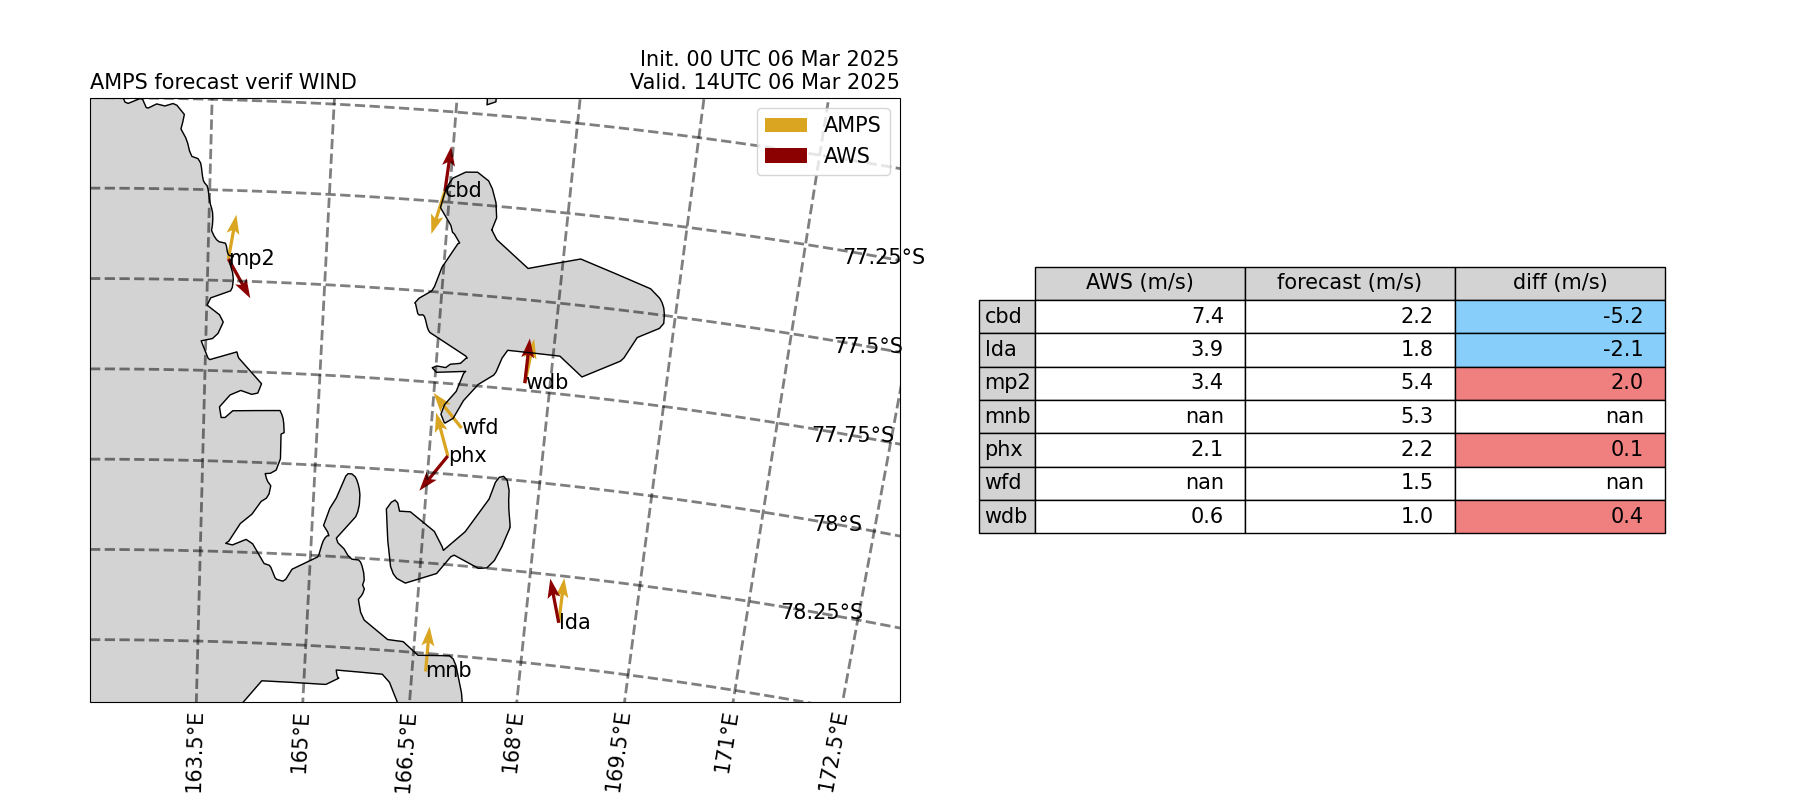
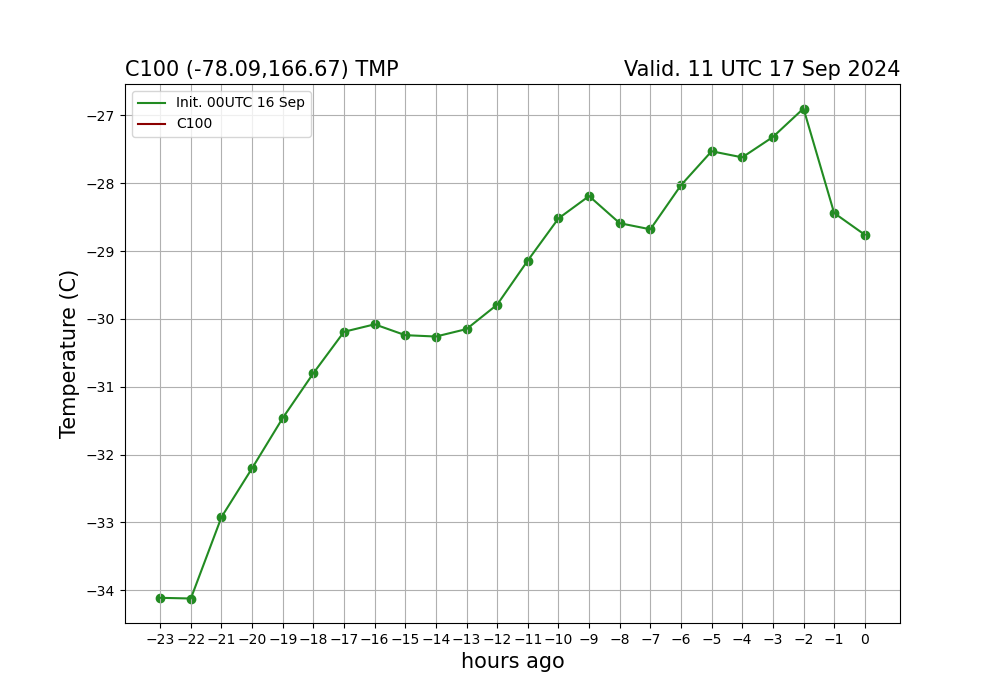
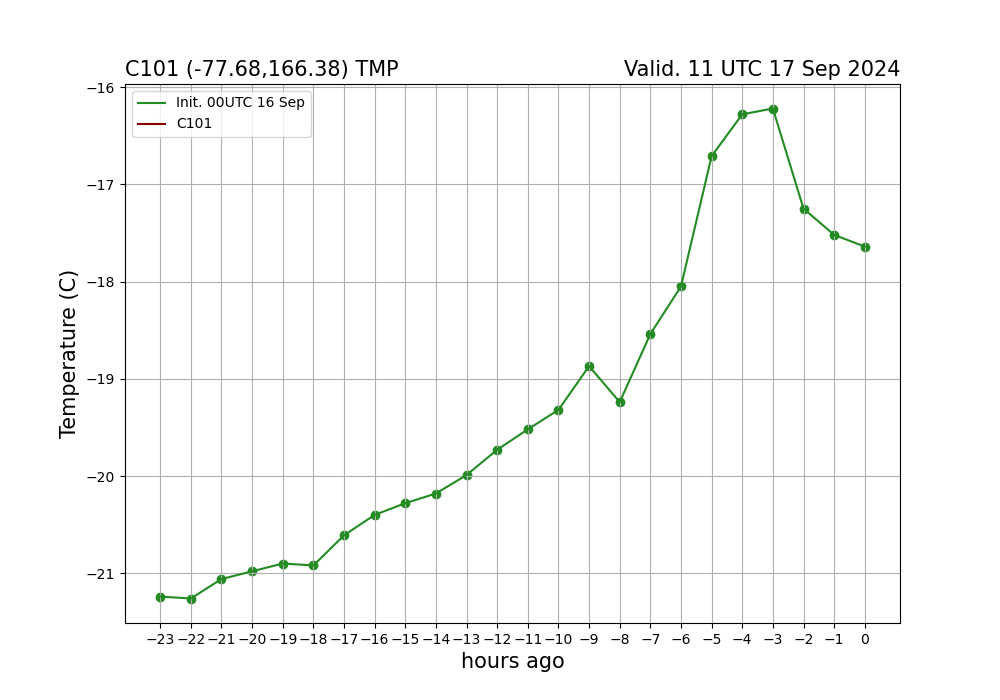
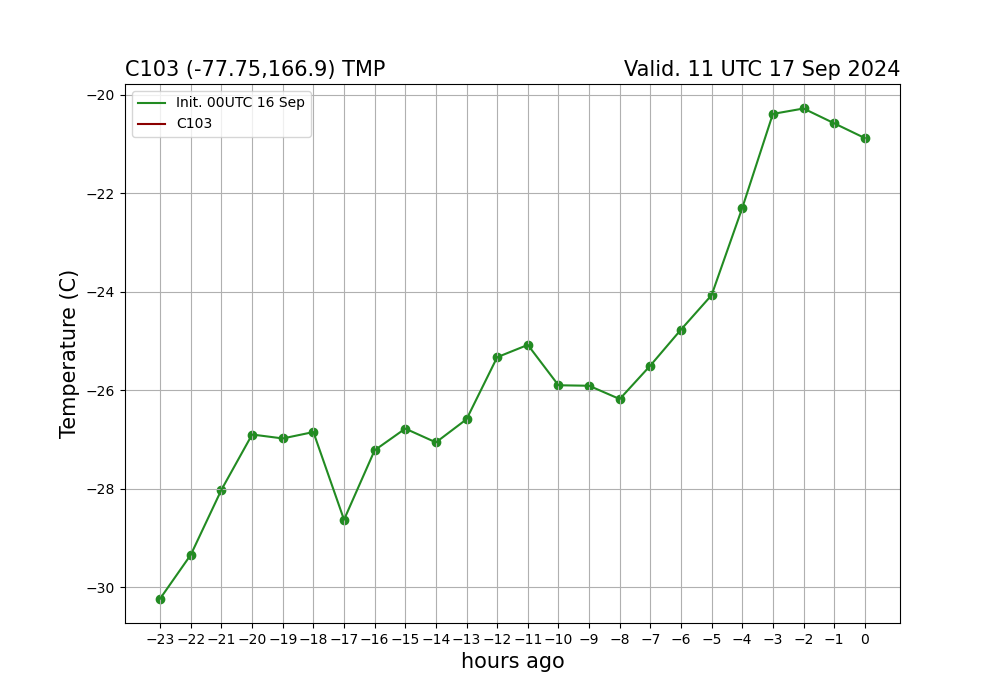
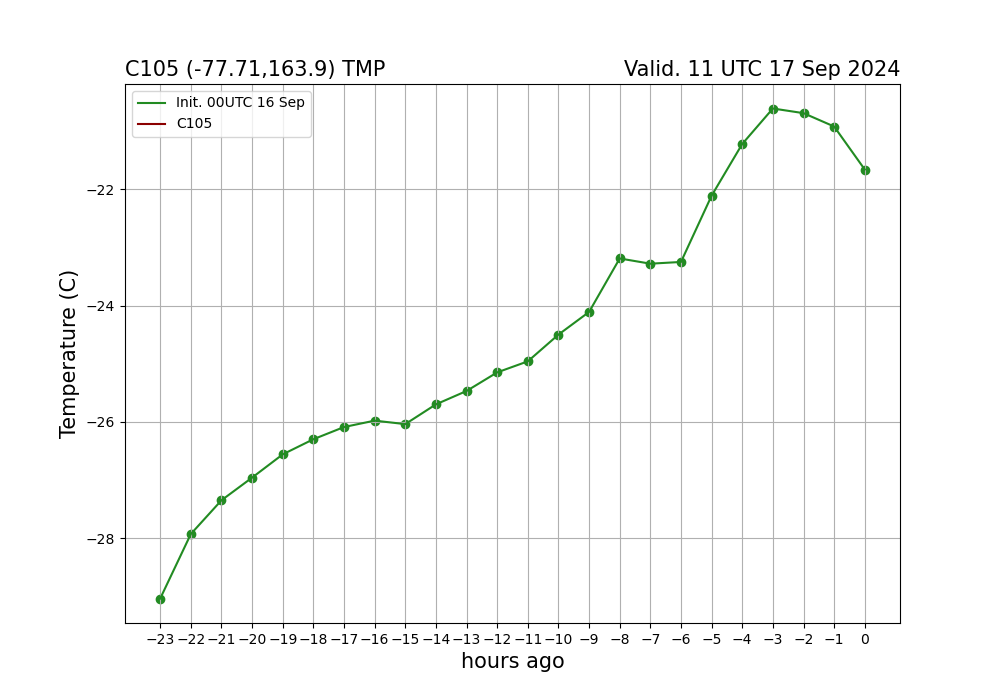
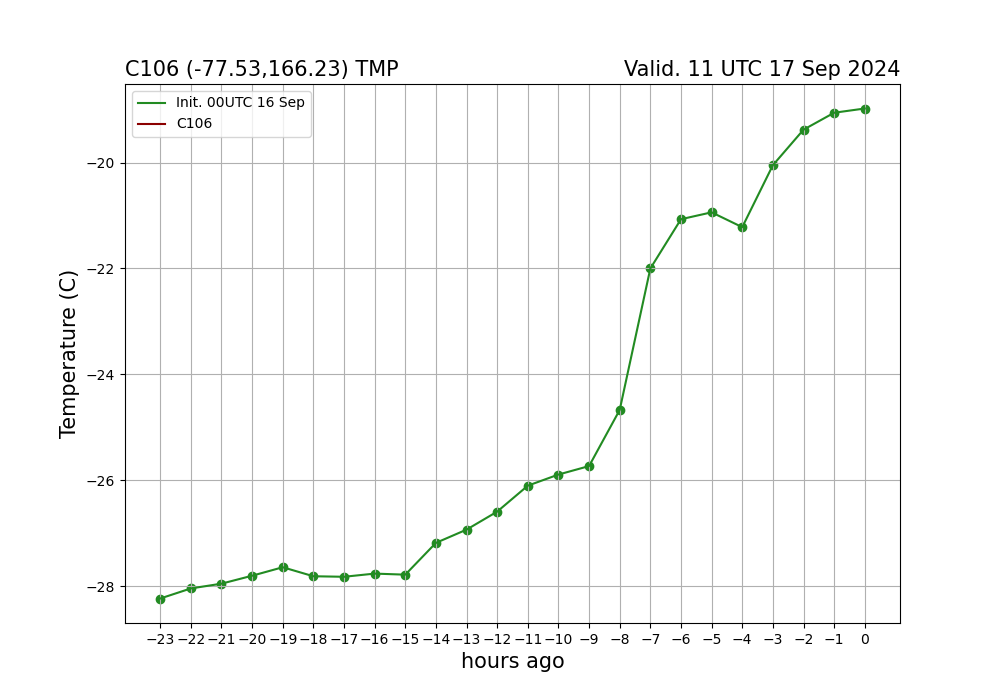
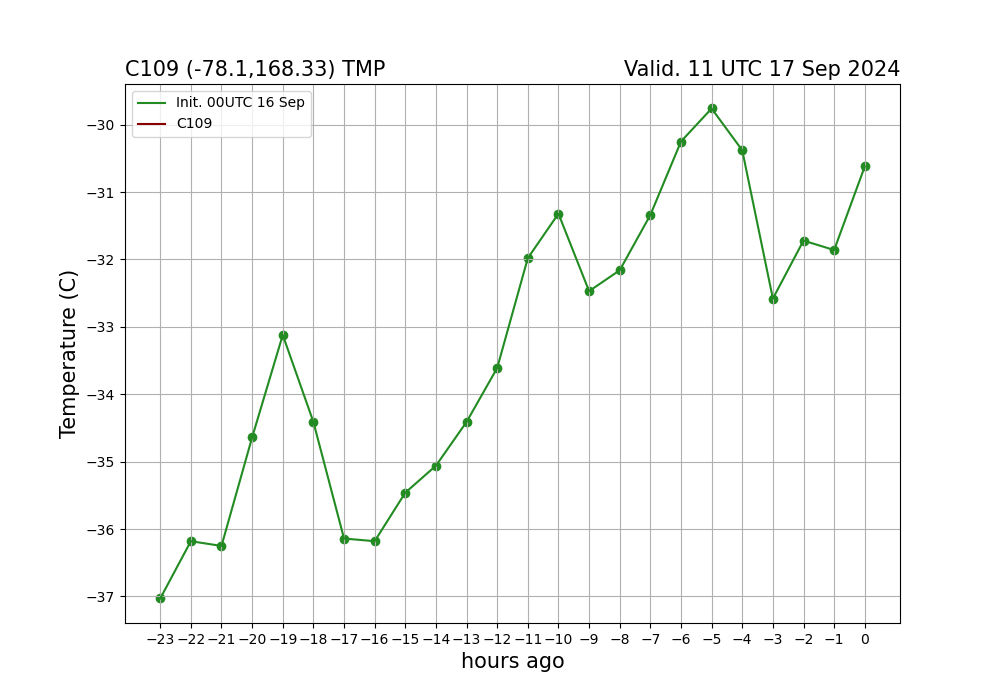
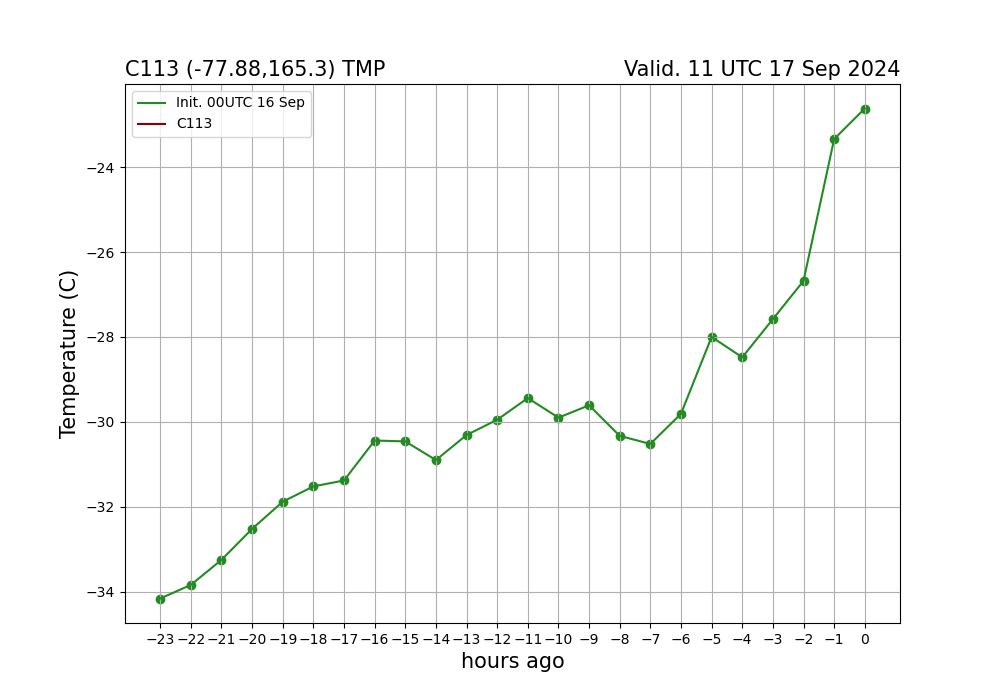
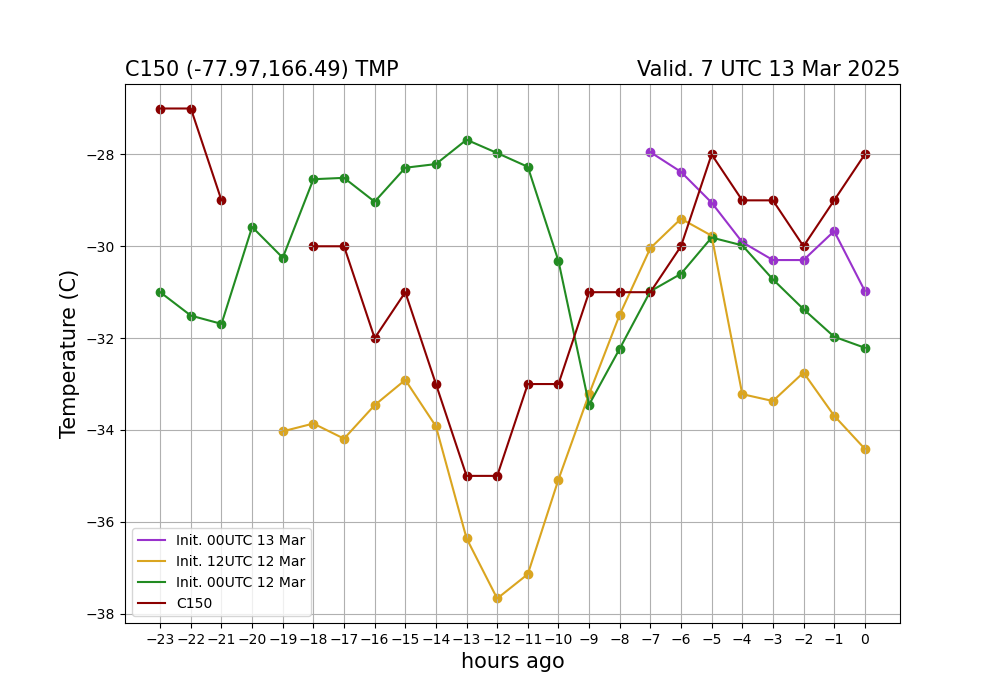
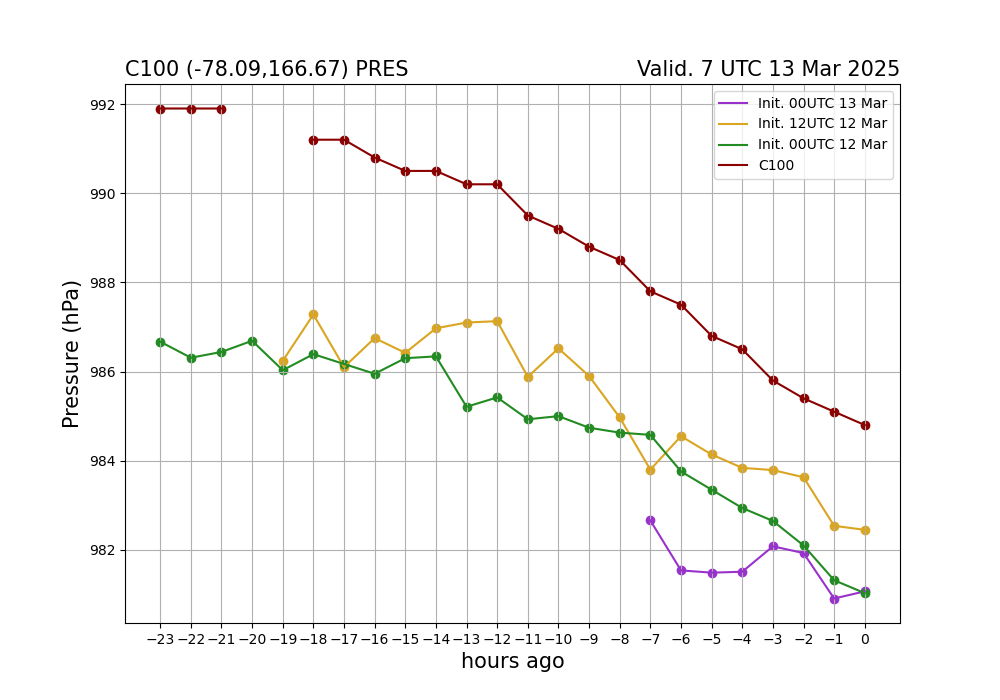
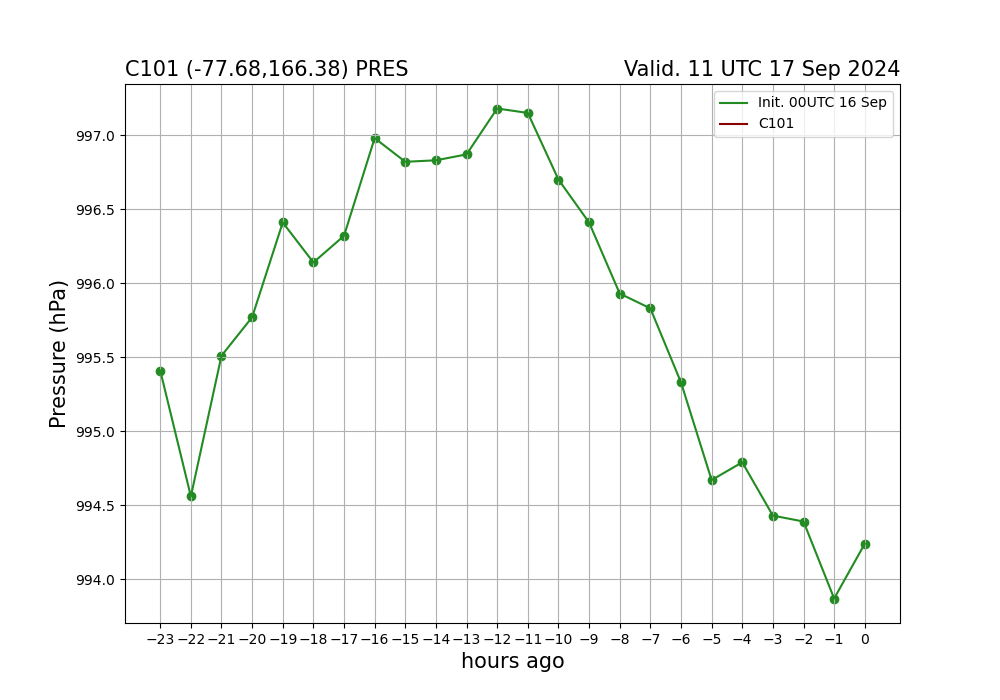
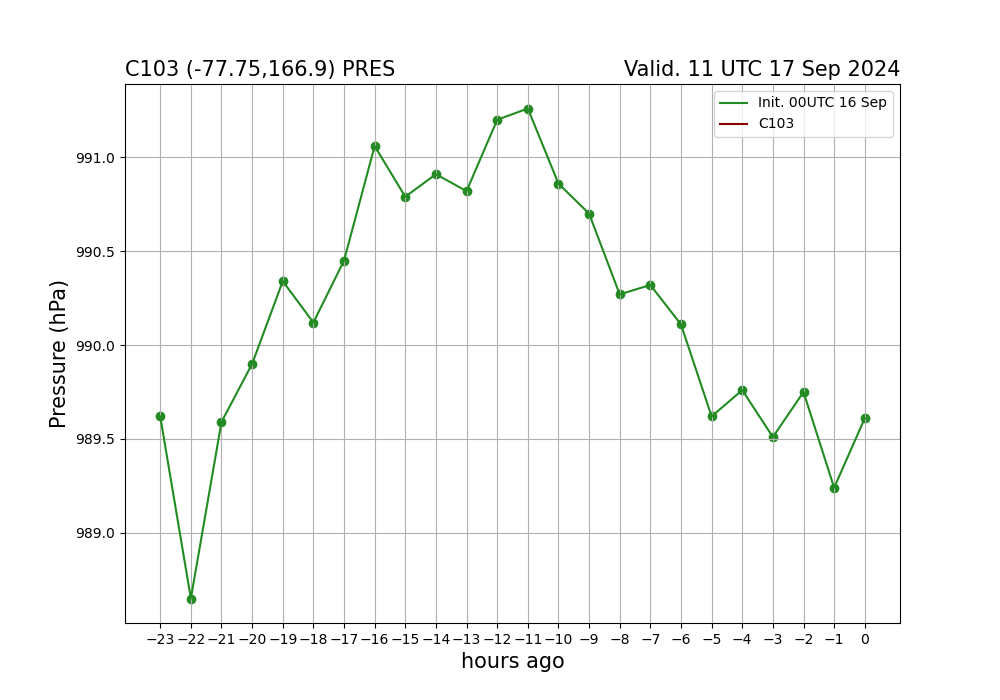
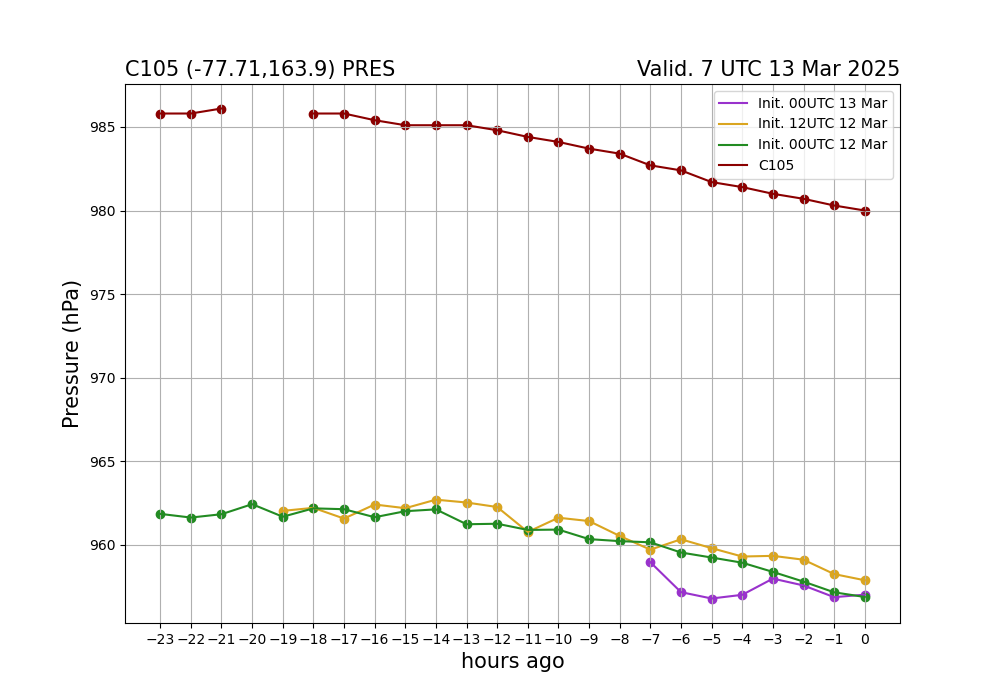
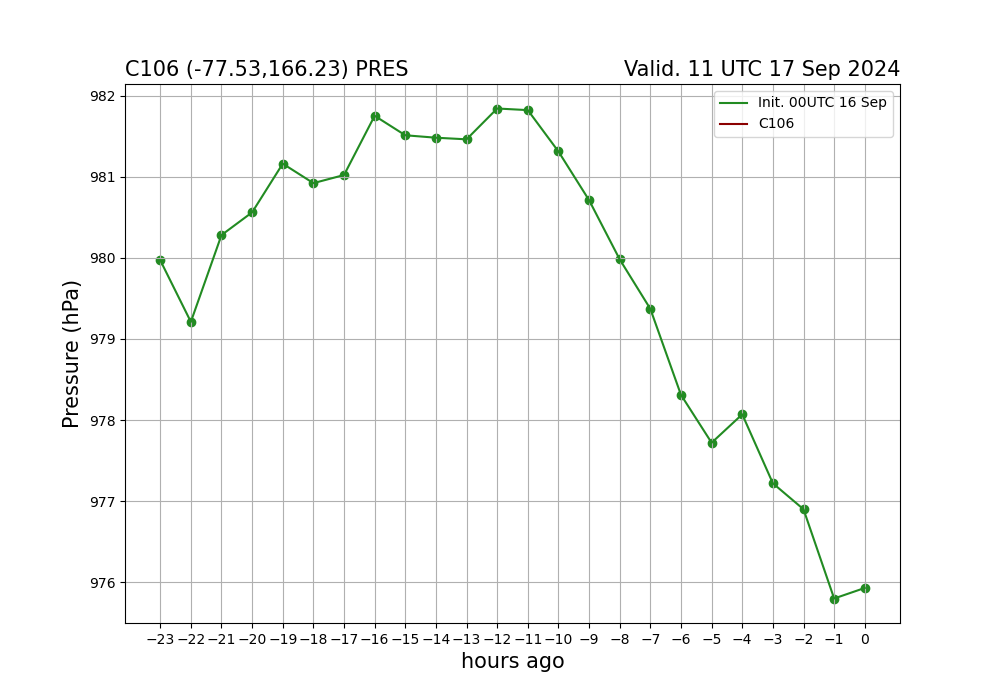
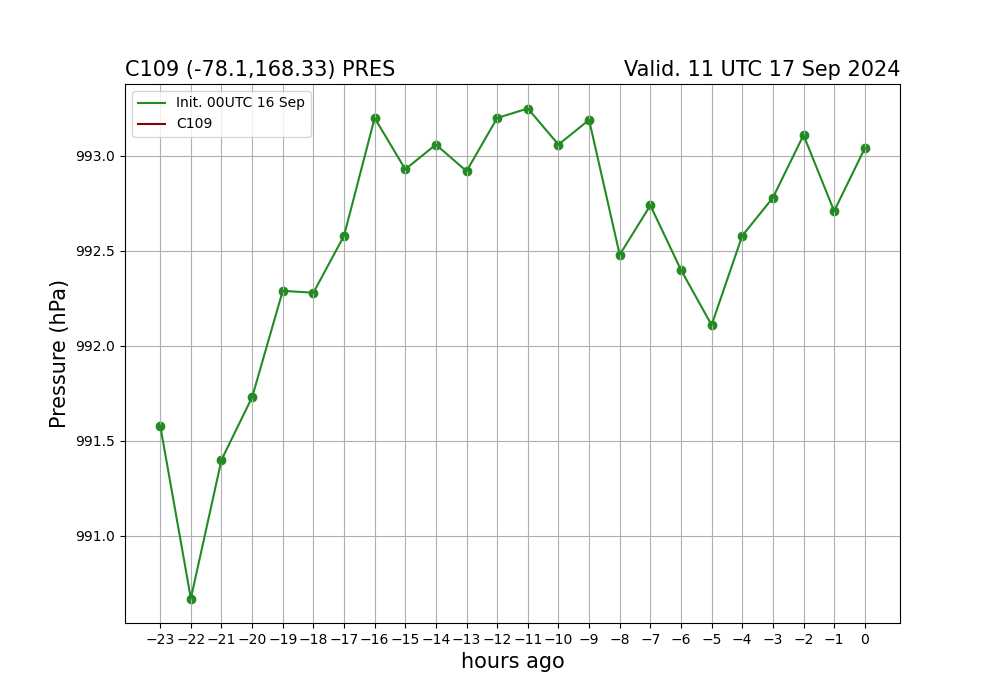
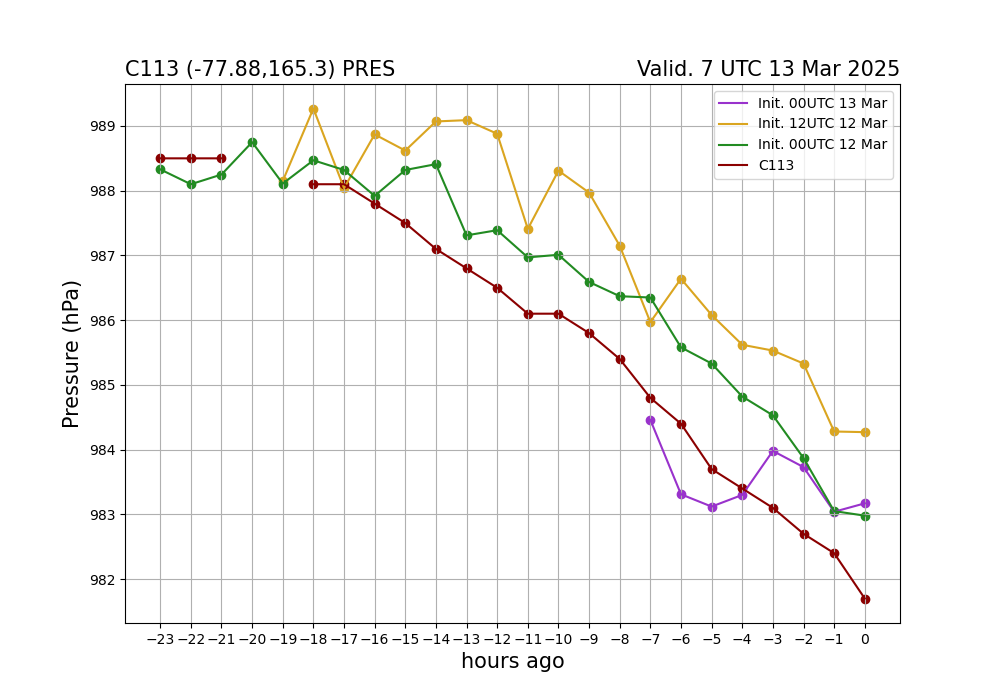
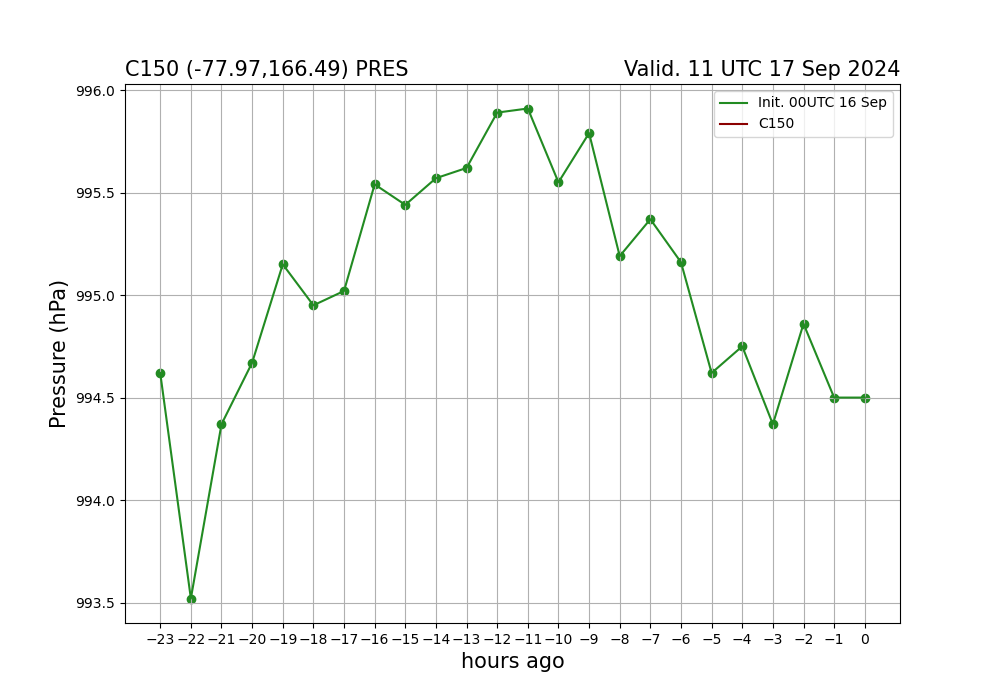
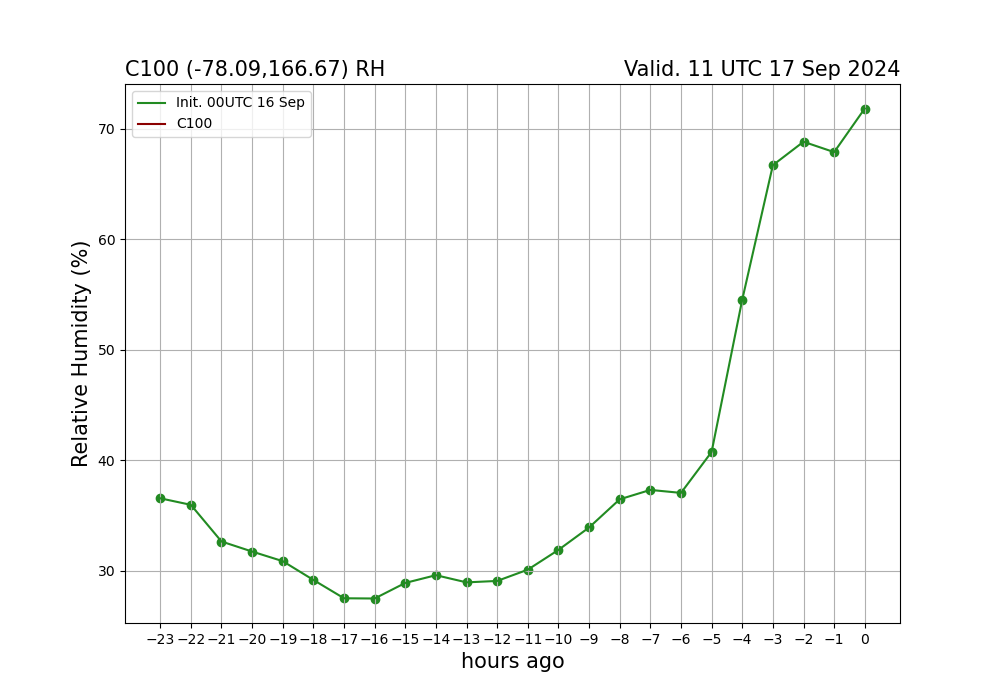
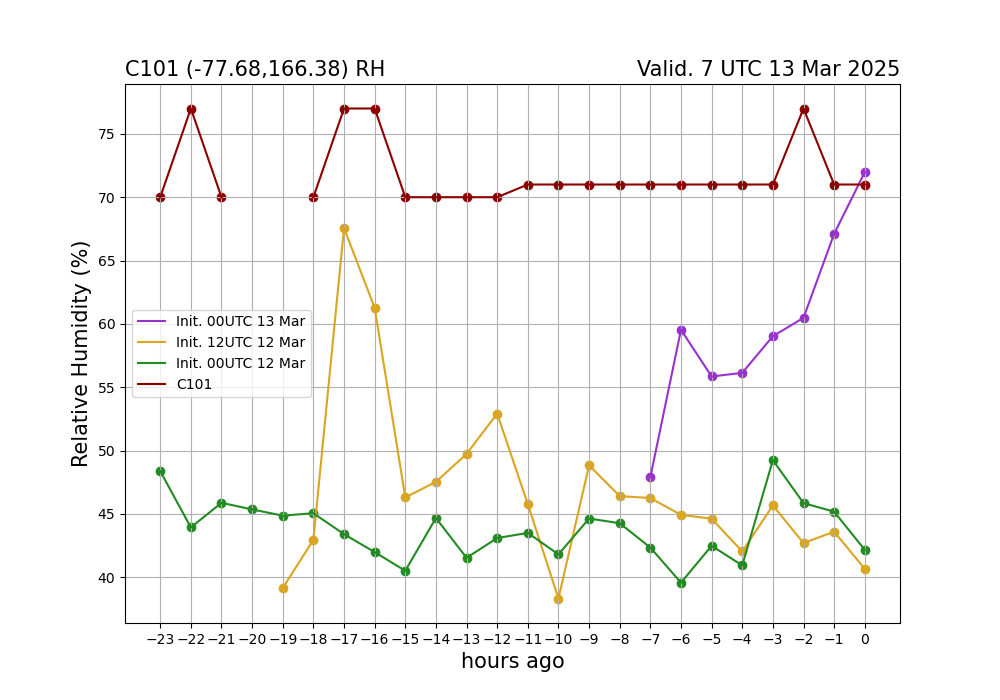
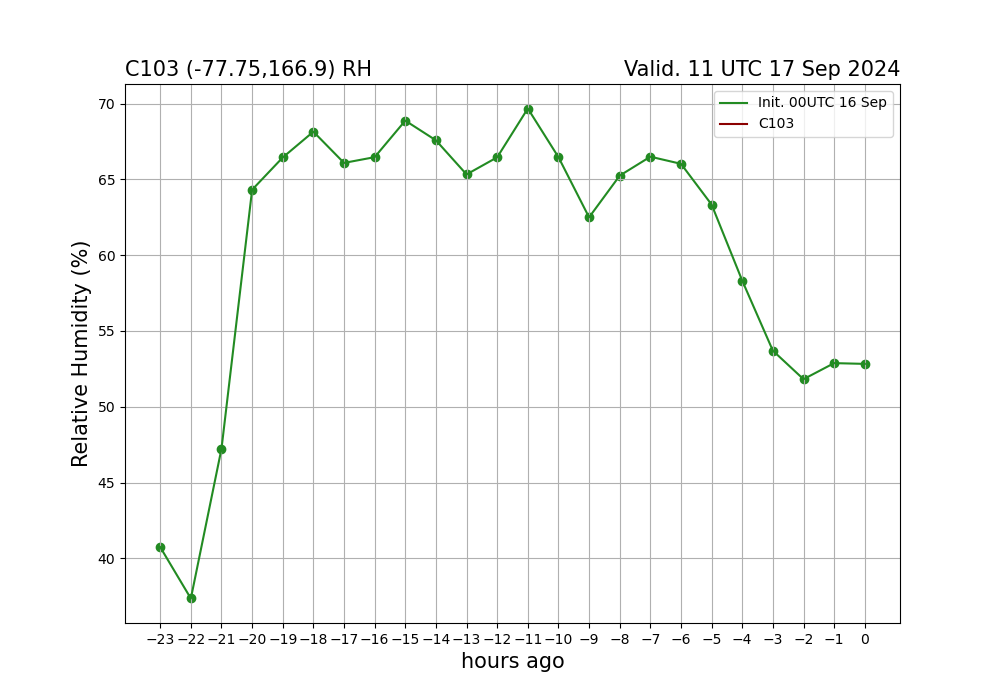
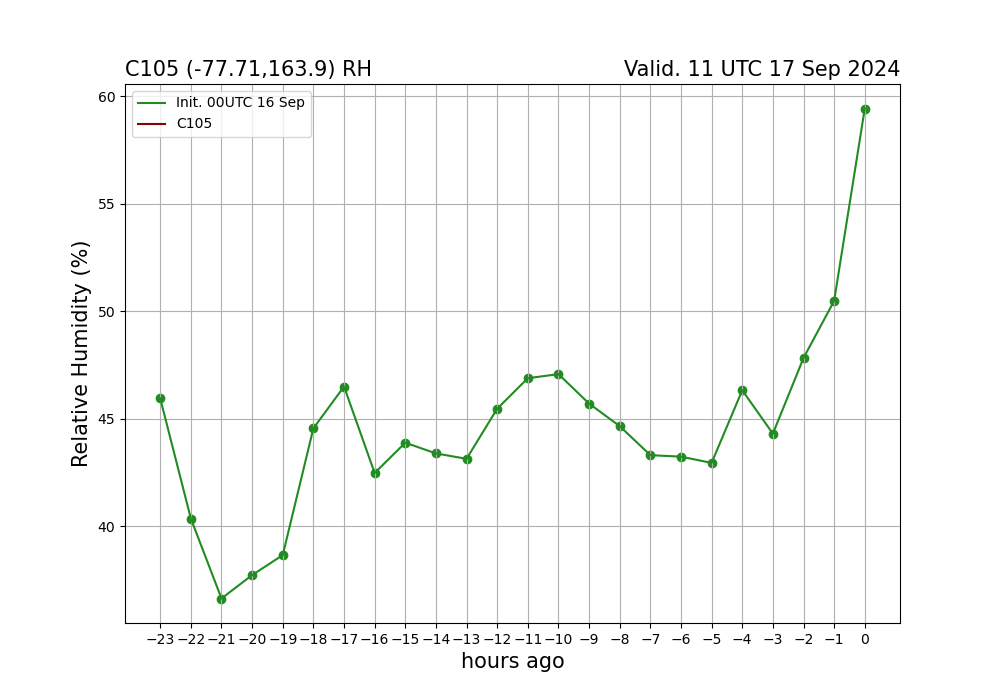
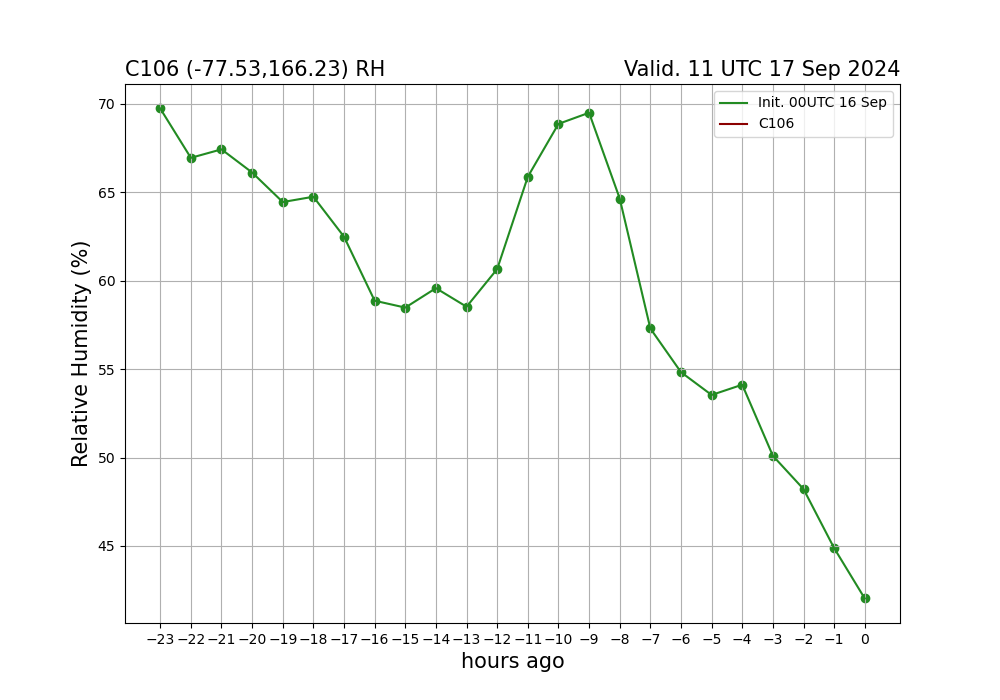
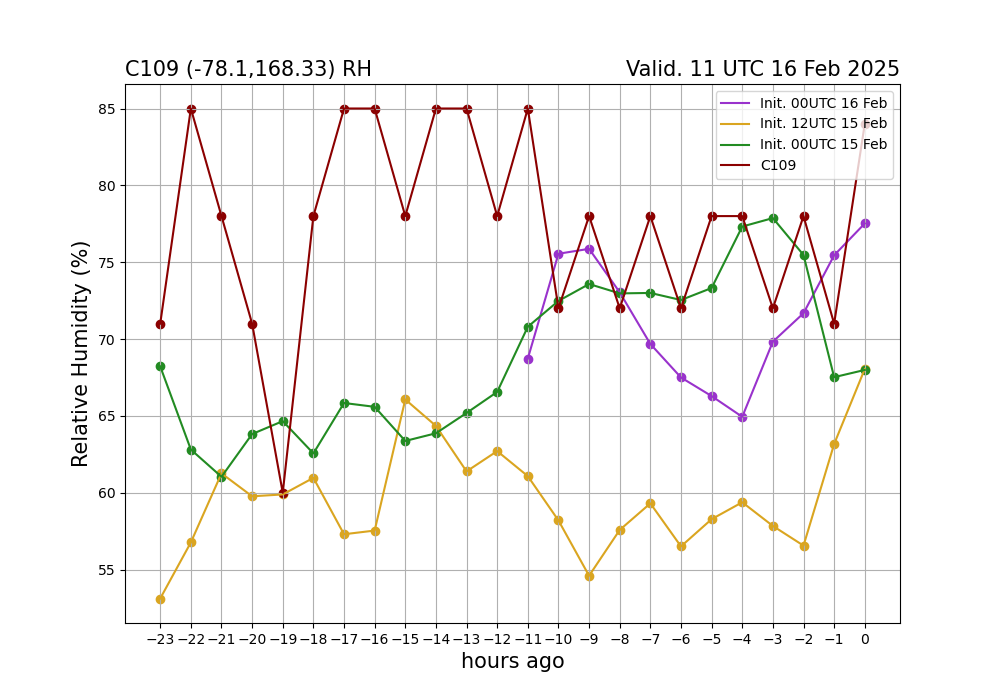
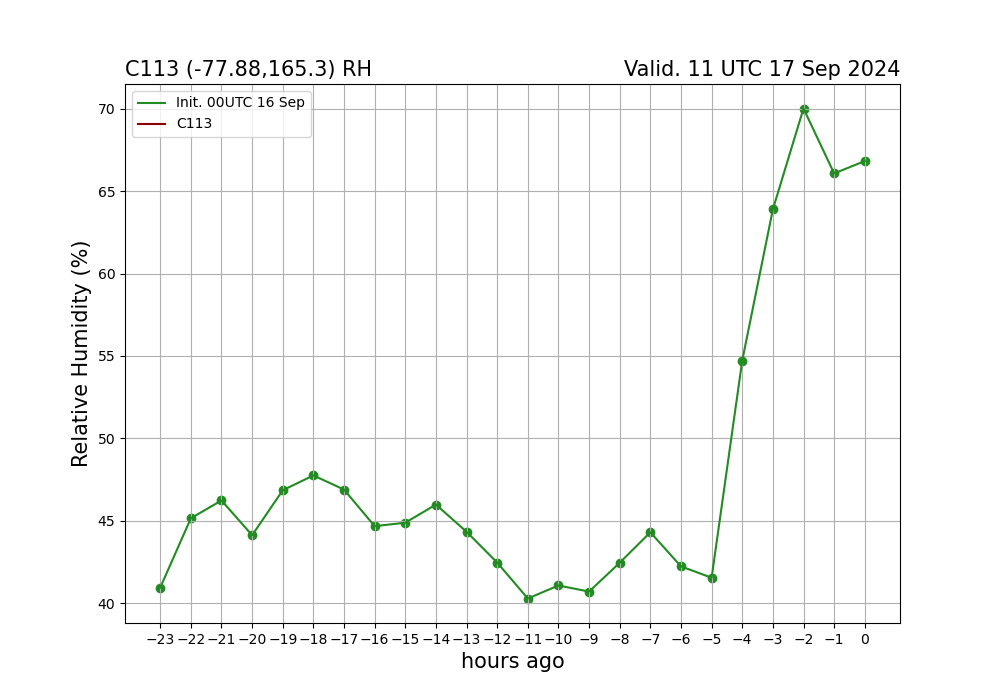
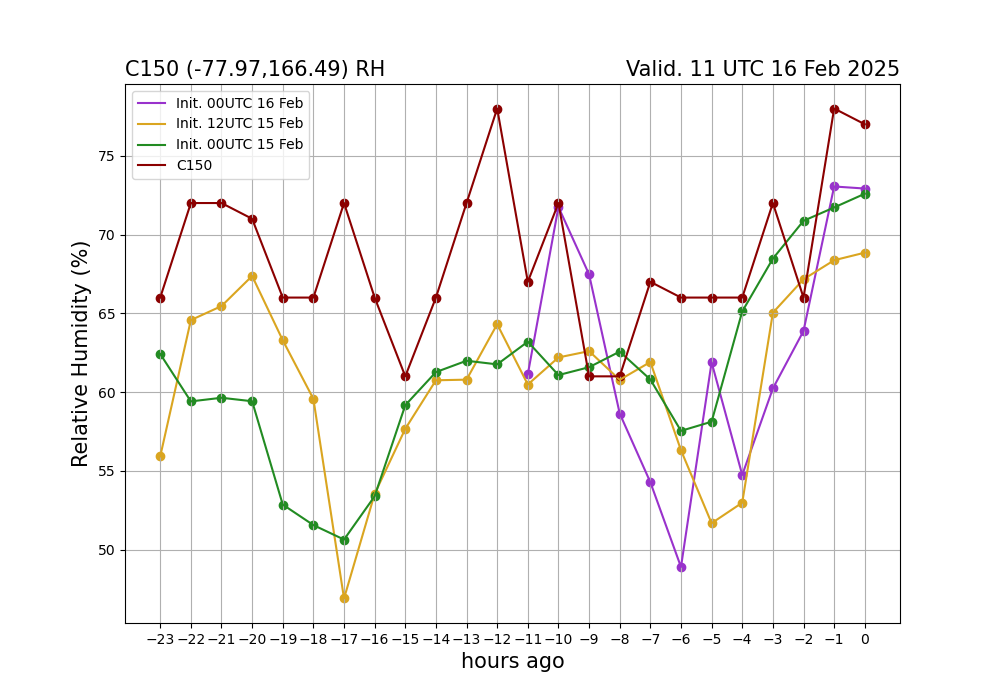
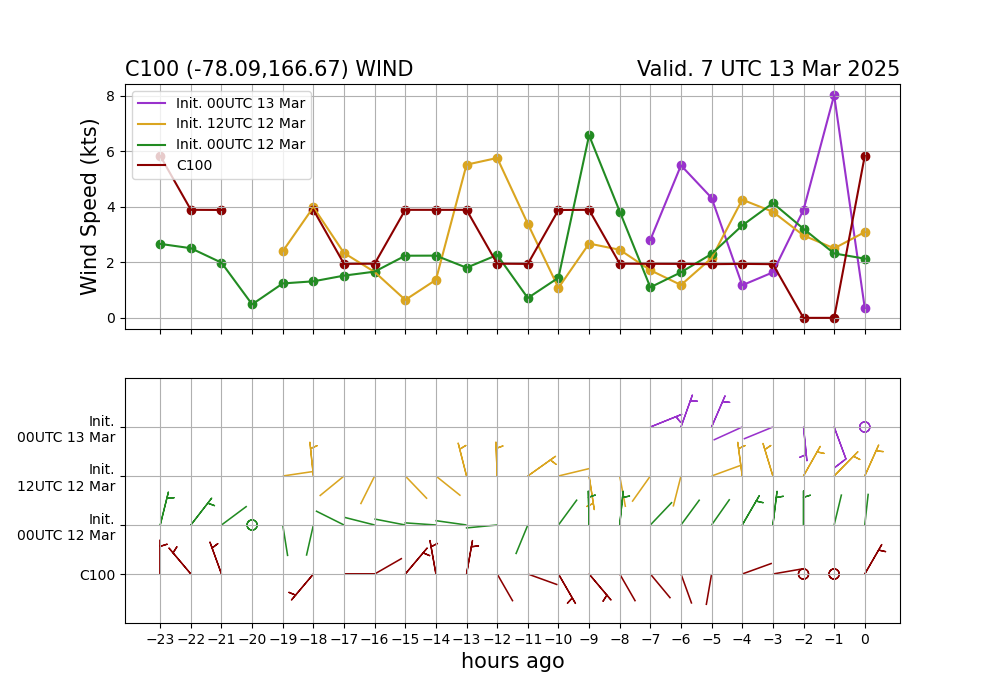
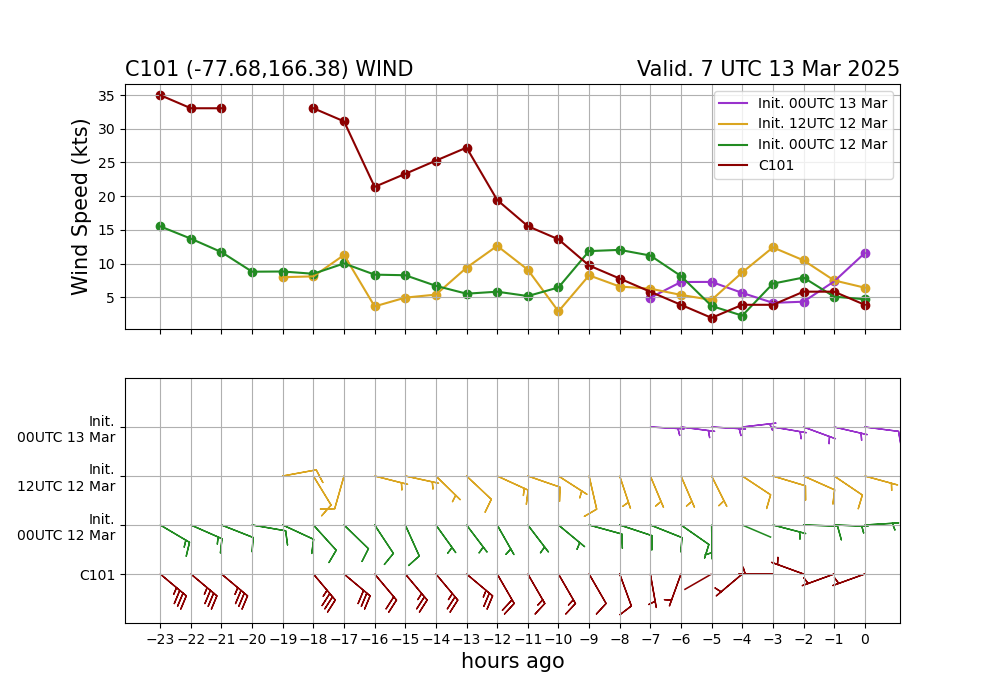
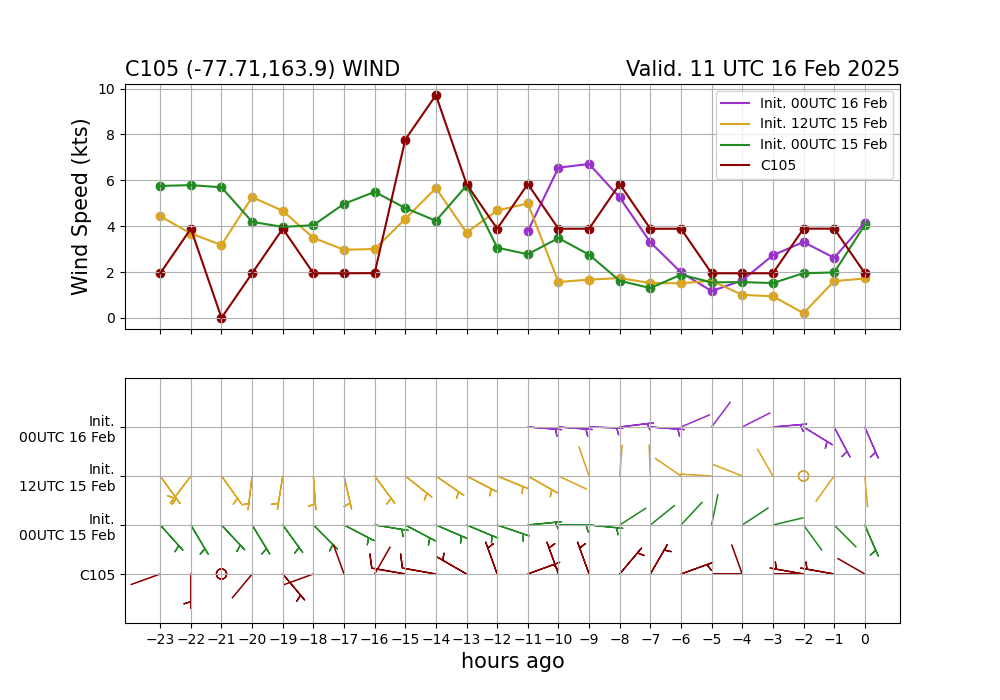
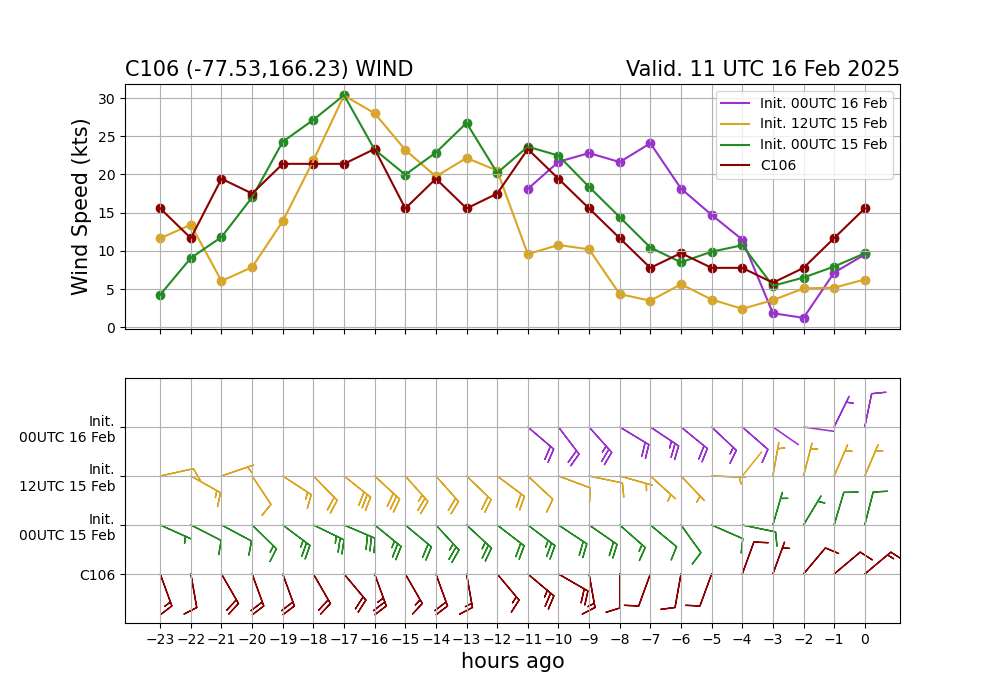
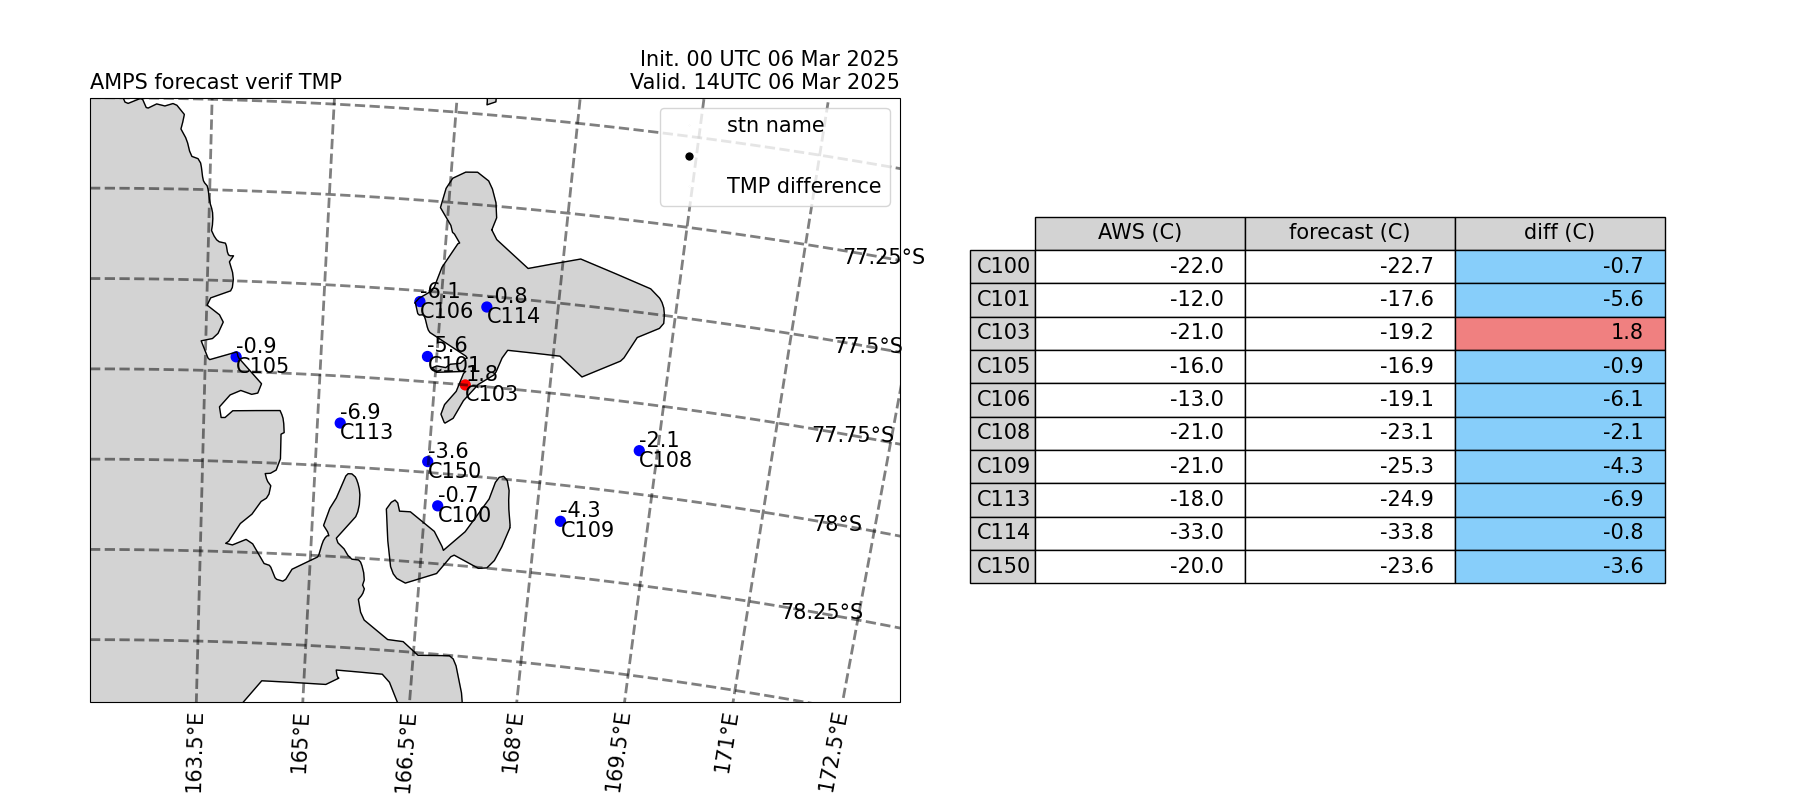
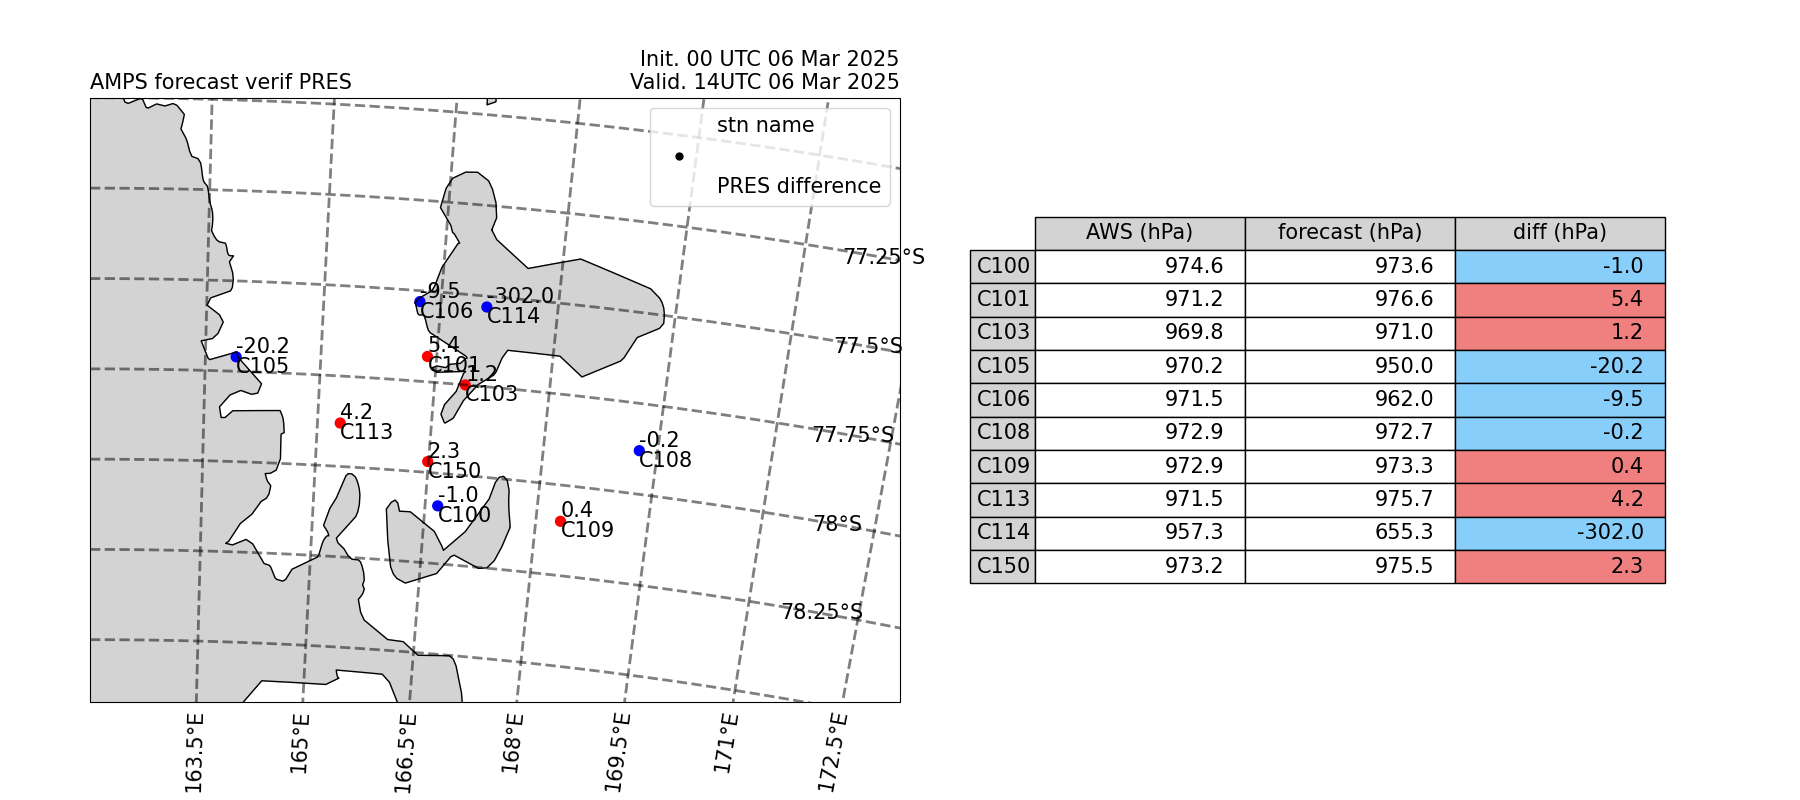
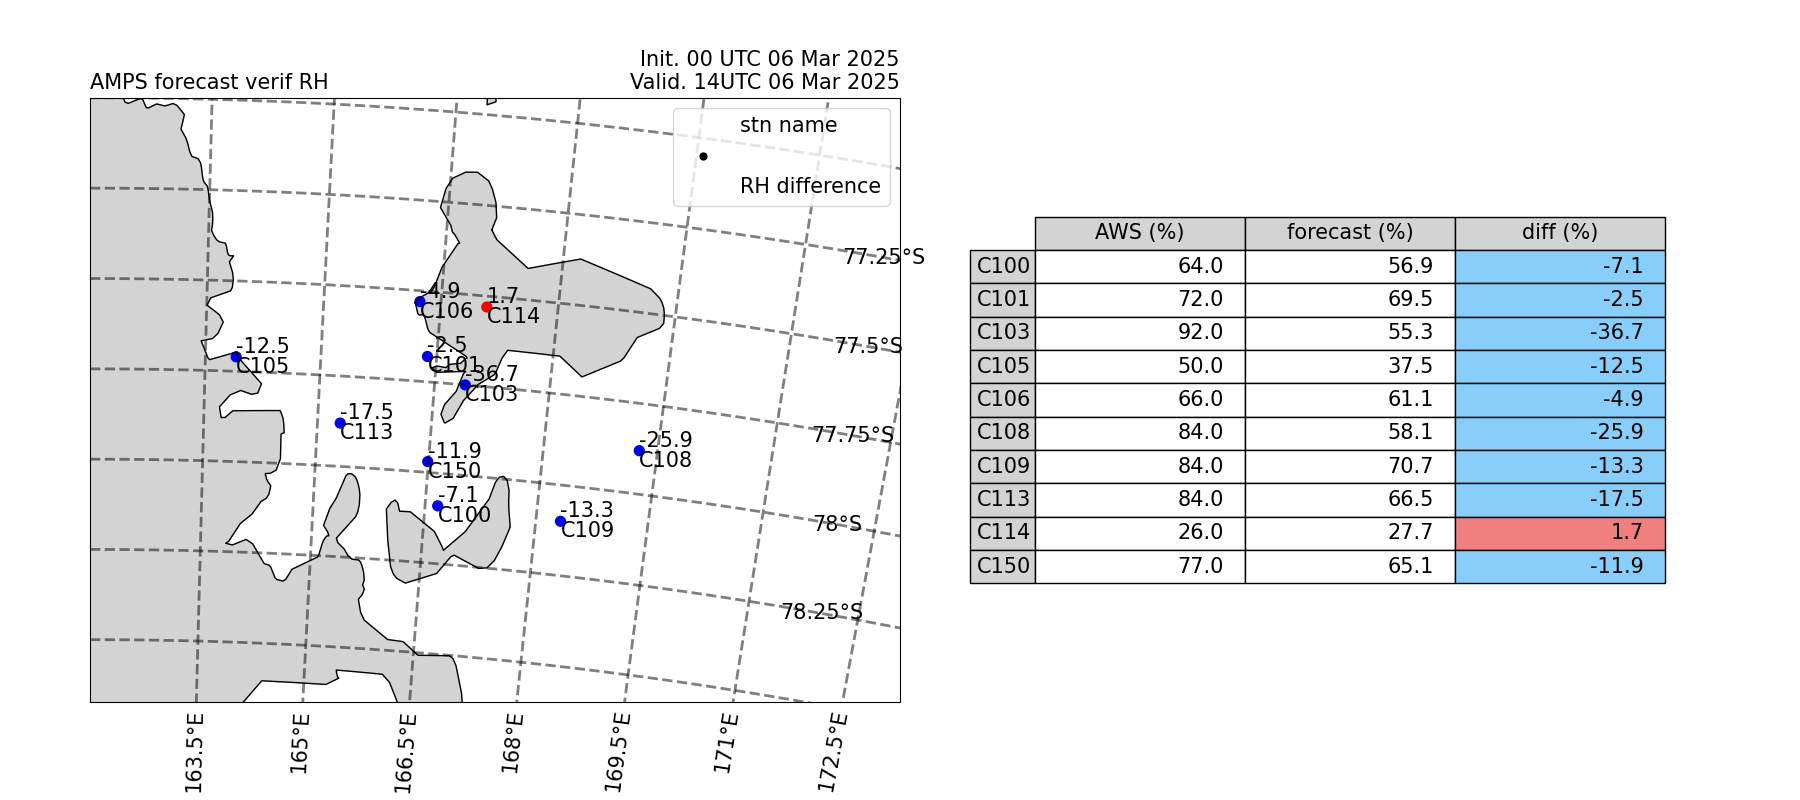
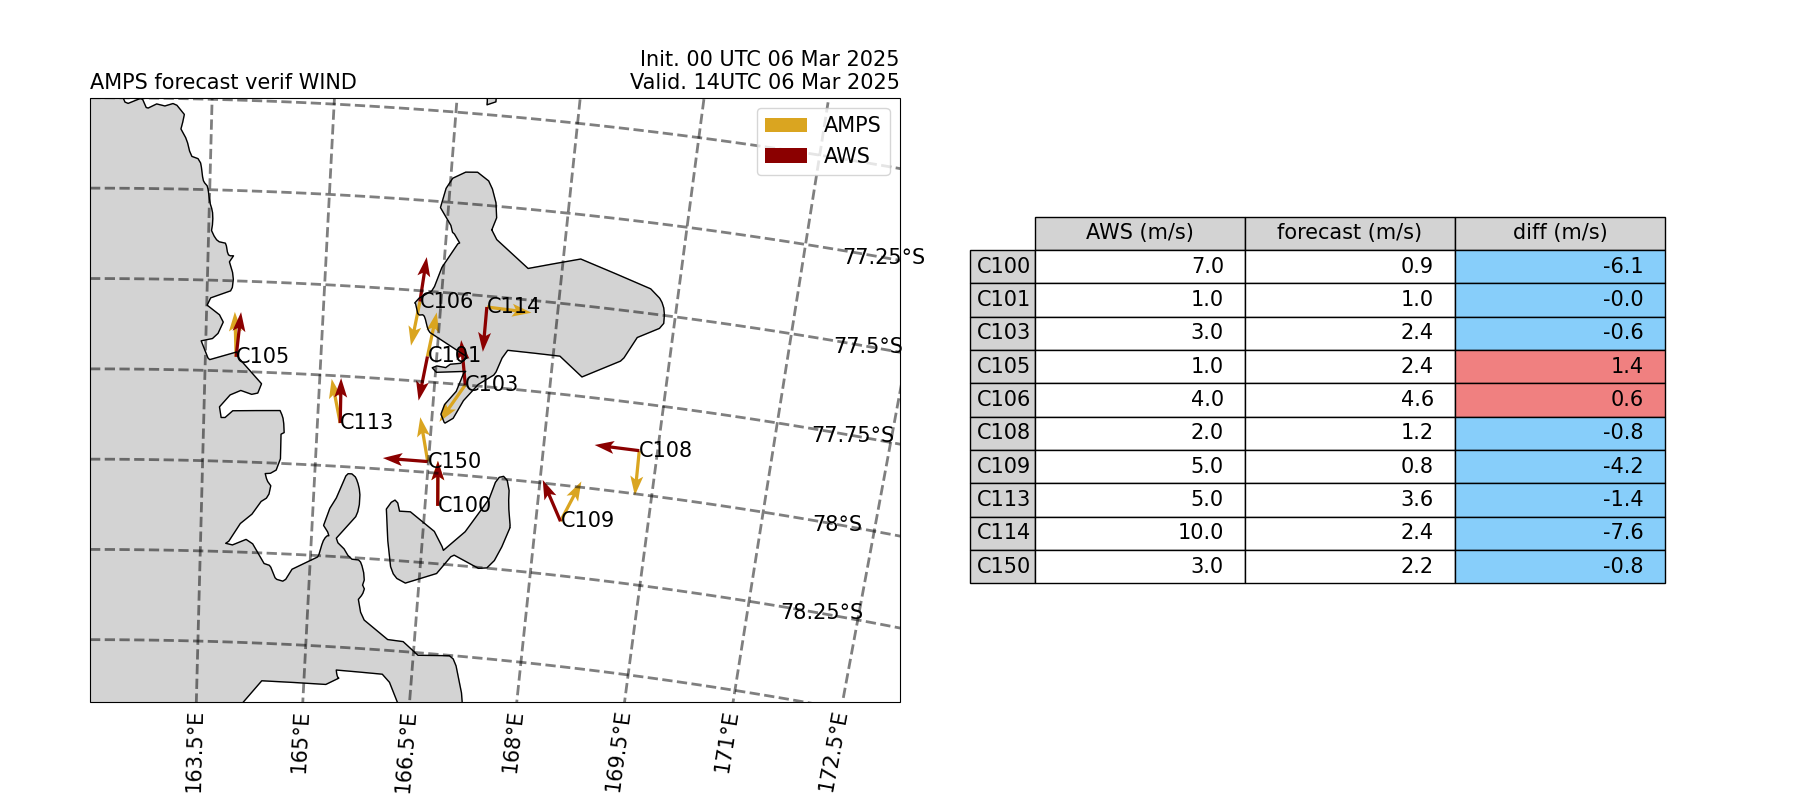
This page contains links to time series plots of Automatic Weather Station (AWS) observations and the Antarctic Mesoscale Prediction System (AMPS) output. Each plot contains one variable (temperature, pressure, relative humidity, or wind) for the most recent 24 hours of data. The left column of links contains UW stations, and the right column contains the Naval Information Warfare Center (NIWC) stations. Below the time series links are links to map plots. These plots again contain AWS observations and AMPS output, but contain all stations’ data for the current hour. The link at the top of the page links to a dashboard that enables auto-refresh displays of plots.
Time series plots will indicate the AMPS and AWS status in the legend. If the output status is good, no indication is made. The AMPS output status will be noted as “missing” when the AMPS model run is not available at all. The AMPS output status will be noted as “NA” when the AMPS model run is not yet available, but may be in the future. The AWS status will be noted as “bad” when the data is unreliable. The AWS status will be noted as “okay” when the data is partially unreliable. The AWS status will be noted as “NA” when the data is not available.