 The overarching goal of this project is to determine and verify the optimal placement of surface meteorological observations in Antarctica that will sufficiently aid in forecast products made by the Antarctic Mesoscale Prediction System (AMPS). This study is based on prior work by Bumbaco et al., 2014. A particular point of interest in determining the impact of surface observations on AMPS output is in East Antarctica, specifically in the megadunes region. Available Automatic Weather Station (AWS) data from the megadunes region, observing surface temperature, pressure, and wind speed and direction, are to be quality-controlled to aid in this study.
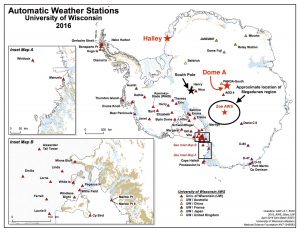
In the latest work on this project as of 2020, synoptic observational data were acquired for thirteen staffed stations across Antarctica: Neumayer, Amundsen-Scott, Halley, Bellingshausen, Rothera Point, Syowa, Mawson, Davis, Dome A, Mirnyj, Vostok, Casey, and Cape Ross. Data were quality-controlled and are available on our ftp site here: ftp://amrc.ssec.wisc.edu/pub/aws/antoptnet-qc/. Below, two examples of quality-controlled temperature data are shown for Halley, a staffed station, and Dome A, a non-Wisconsin automatic weather station. The Antarctic map at the top of this page shows the approximate locations of these two sites.
In previous work on this project, data were acquired for two AWS in the megadunes region: Little Mac (years 2004-2005) and Zoe (years 2004-2012). These were acquired from the National Snow and Ice Data Center.
Data from Zoe (approximate location indicated by red star on map above) were quality-controlled for the years 2008 and 2009, for use in analysis with AMPS model output. With quality-controlled data from Zoe AWS, an important step was to determine the impact of the observations on the 2-meter temperature field from AMPS output. Quality-controlled data files were created for Zoe AWS in the following monthly file-types: 10-minute, one-hourly, and three-hourly. These files can be found on our ftp site here: ftp://amrc.ssec.wisc.edu/pub/aws/zoe_aws/.
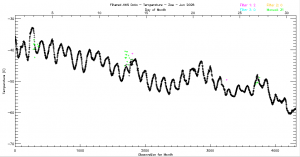
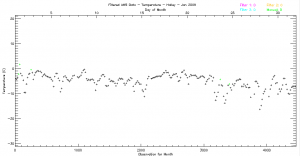
Screenshots of the IDL graphical user interface for performing quality control on temperature are shown below, for Halley, Dome A, and Zoe AWS. In the screenshots, erroneous data are indicated by either green or magenta markers.
Halley Temperature, January 2009
Dome A Temperature, January 2009

Zoe AWS Temperature, June 2008